Revenue leakage is the gap between the revenue a dental practice legitimately earns and the revenue it collects. It is money for care already delivered that never reaches the bank account, not because of one dramatic failure, but through small, preventable losses scattered across the revenue cycle: a claim nobody worked, an underpayment nobody flagged, a balance that quietly aged into a write-off.
Each individual leak is small enough to overlook, and most never show up as a line item, so the total stays invisible until the distance between production and collections gets too wide to ignore. The clearest single measure is your net collection rate: the share of collectible revenue you collect. Healthy practices run above 98%; the common range is 92 to 95%, and every point below 100 is leakage living somewhere specific. This glossary names those somewheres, in the order money moves through the practice, so you know where to look.
A glossary of the leak points (and where each one hides)
Eligibility gaps. Treatment delivered against coverage that was inactive, exhausted, or misunderstood, because verification happened after the visit instead of before. Hides in: denials coded for coverage issues, and patient balances that were never really collectible. The most preventable leak on this list.
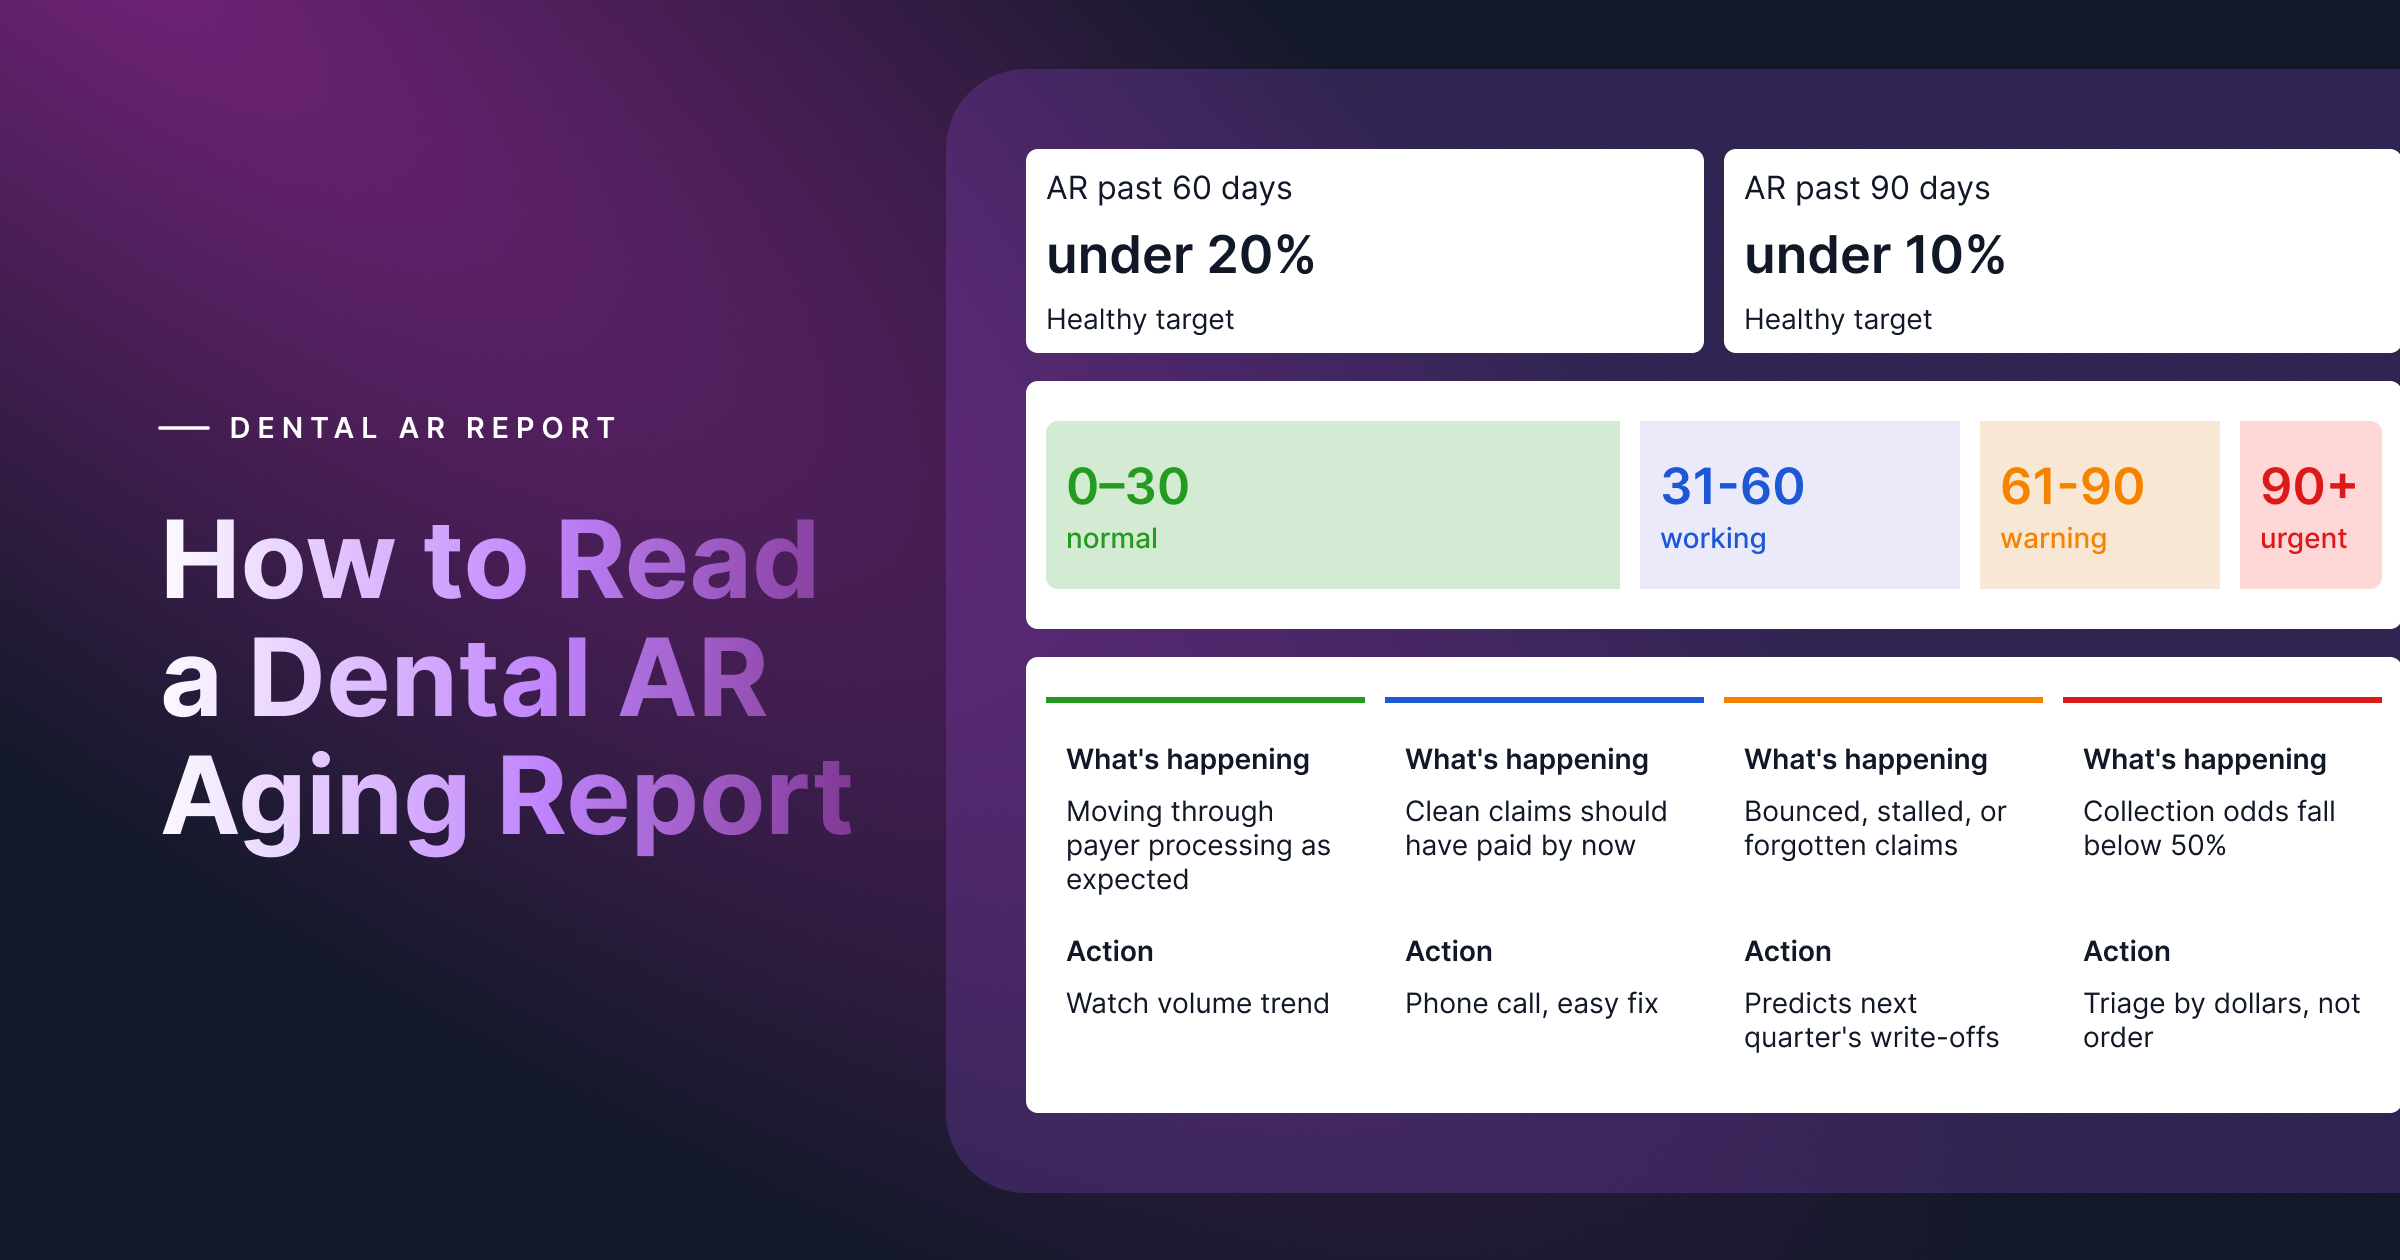
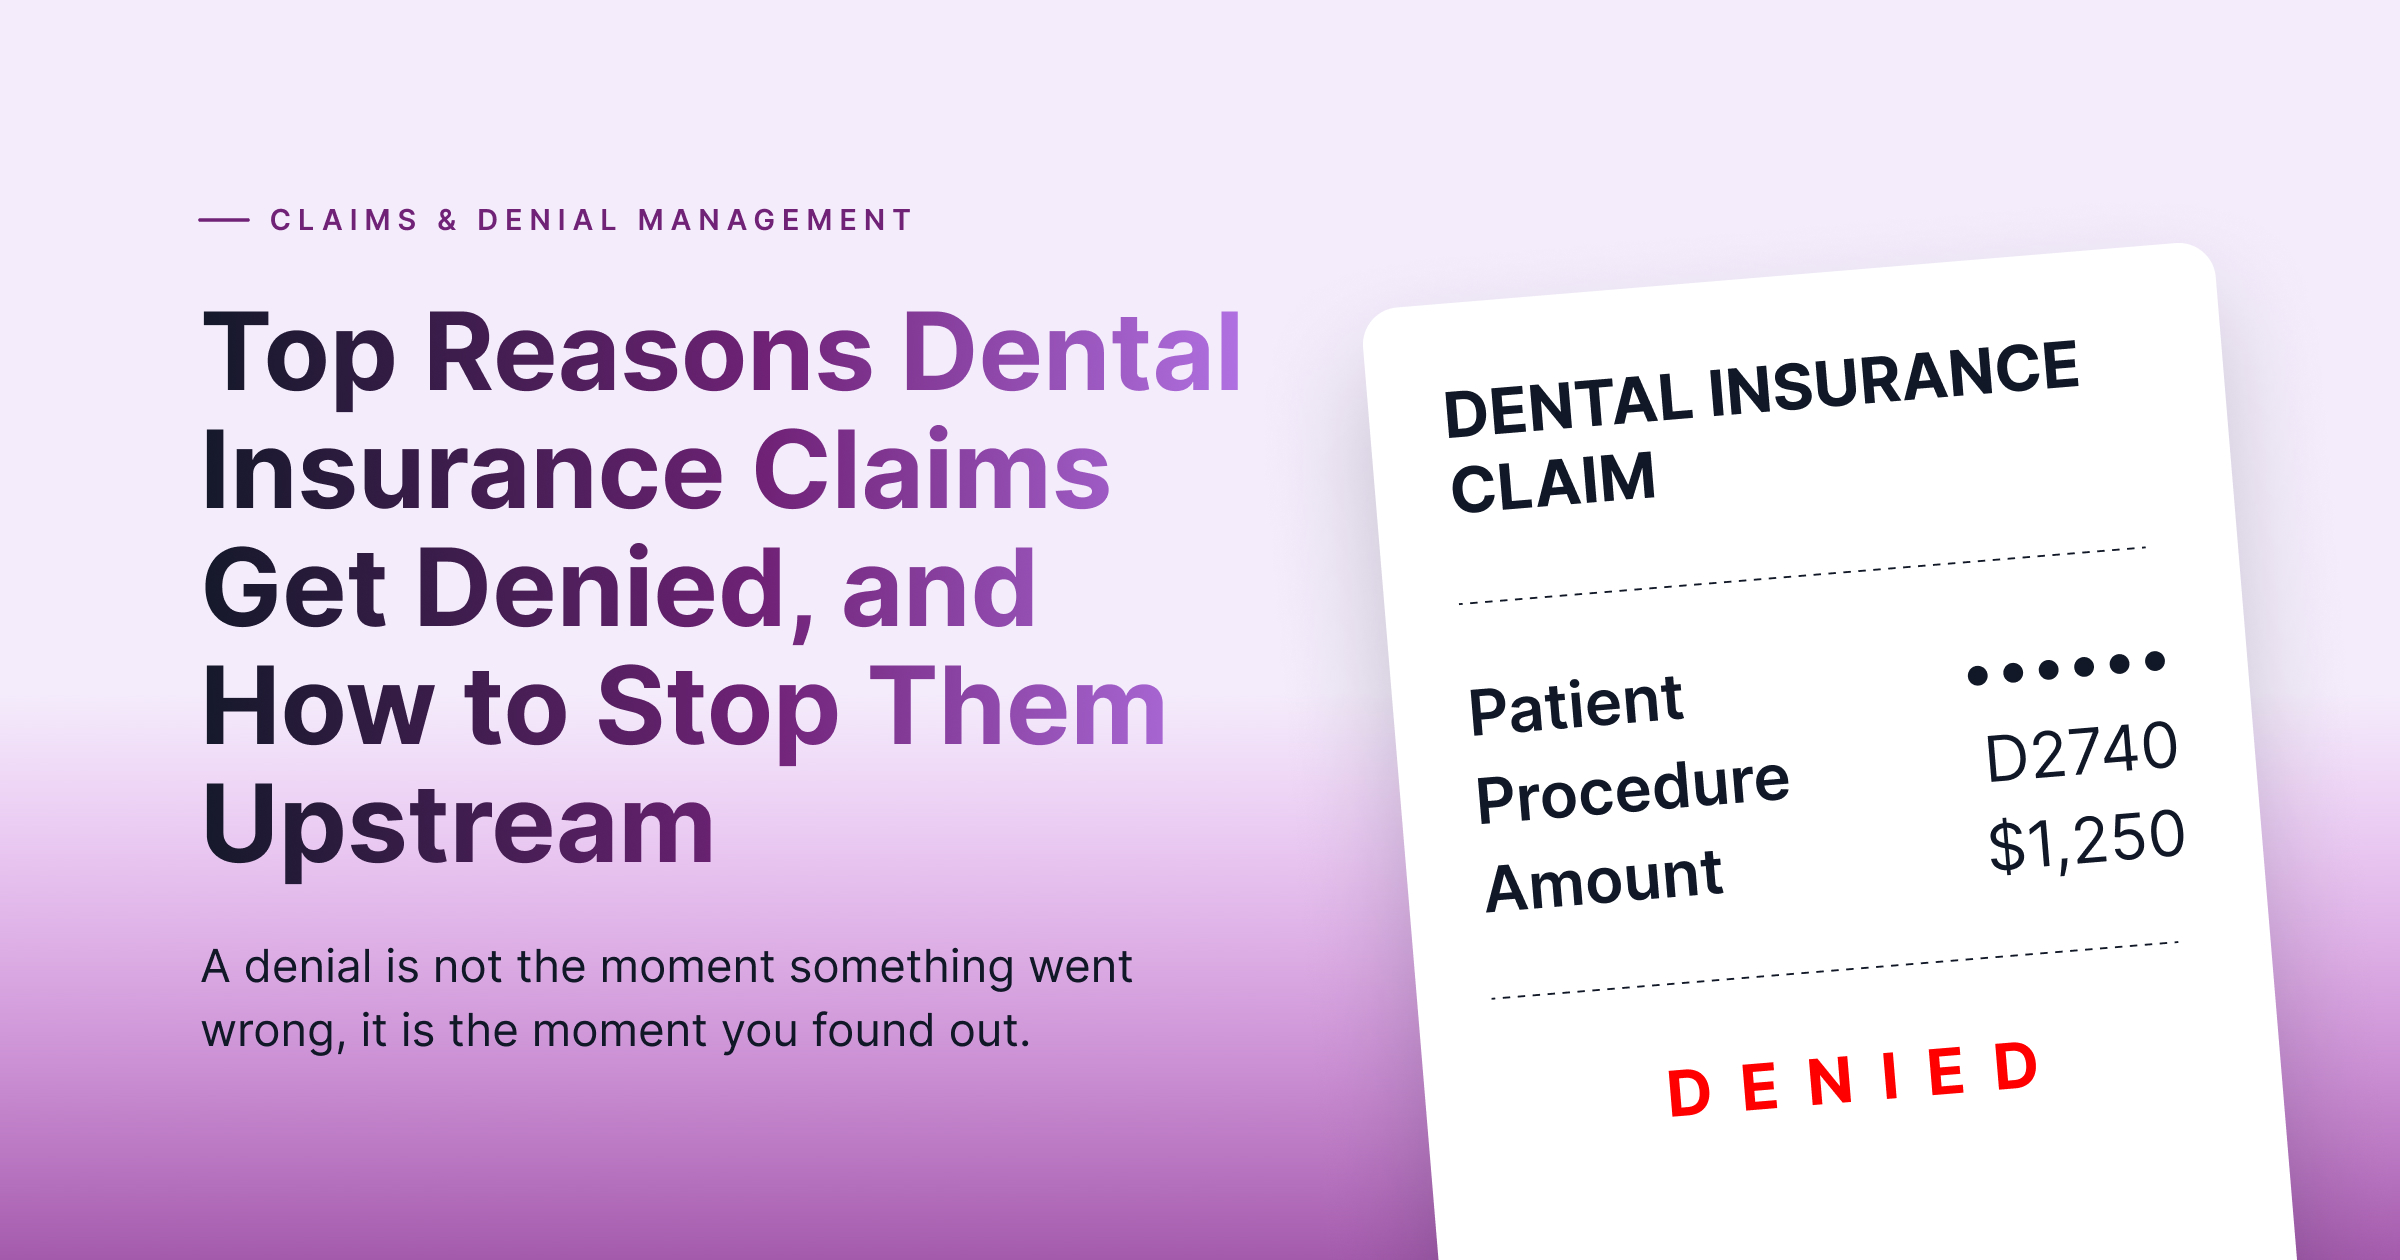
Unworked rejections and denials. Claims that bounced and then sat, unowned, in a work queue. Every denial has a clock, and one that is not worked inside the payer's window converts from recoverable revenue into a write-off. Hides in: the 61-to-90 and 90-plus buckets of your aging report, and in denial reports nobody reviews monthly.
Underpayments. Claims paid, but paid short of the contracted rate. These are the quietest leak of all, because a paid claim looks finished, and payers do not send an alert when they have shorted you. Hides in: the gap between posted payments and fee schedules, which almost nobody reconciles line by line at scale.
Downcoding and bundling. The payer reimburses a cheaper code than the one billed, or folds two procedures into one payment, and nobody contests it. Accepted silently, the reduced rate becomes the new normal for every claim that follows. Hides in: adjustment codes on remittances that get posted without review.
Timely filing write-offs. Claims, corrected claims, or appeals that missed the payer's submission window entirely. The work was done, the revenue is simply gone, and it is usually final. Hides in: adjustment and write-off reports, often miscategorized as ordinary contractual adjustments so the loss never gets counted as a loss.
Unposted and misapplied remittances. Money that has effectively arrived but sits unposted in portals and mail trays, or gets posted to the wrong claim. This leak distorts more than it destroys: it inflates AR, hides real performance, and buries the other leaks under bad data. Hides in: posting backlogs, unapplied cash, and month-end reconciliation mysteries.
Patient balances that age out. The patient portion that was never estimated up front, surprised someone at checkout, and then aged past the point anyone pursued it. Hides in: patient AR past 60 days and in “small balance” write-off policies that quietly absorb thousands per location per year.
Stalled follow-up. Not a category of claim but a category of time: hours lost to hold music, portal logins, and hunting for statuses, which delays every other fix on this list. Hides in: your team’s calendar. Follow-up capacity spent finding information is capacity not spent recovering revenue, which is how solvable leaks age into permanent ones.
The leak points at a glance
How leaders find leakage
You cannot see leakage directly, so you triangulate it with a handful of numbers read together: net collection rate for the total (above 98% healthy), days in AR for speed (under 30), the share of AR aging past 60 and 90 days for where money is stalling (under 20% and 10%), and denial and first-pass rates for how much rework the front of the cycle is generating. Any one of them can look fine in isolation. Read together, they point at which leak points above deserve the first look.
At DSO scale, add one more rule: break every number out by location and payer before trusting it. Blended figures average healthy offices against leaking ones, which is how a group loses six figures a year while every dashboard stays green. Our 12-step revenue cycle checklist walks the full cycle these leaks live inside, and for the biggest single bucket, we have a dedicated breakdown of reducing AR past 90 days.
Where InsideDesk fits
Every leak on this list survives on the same two conditions: nobody can see it, and nobody has time to chase it. The InsideDesk platform removes both, automating claim follow-up, EOB retrieval and posting, payer calls, and cross-location analytics so the leaks surface themselves and the team’s hours go to recovering revenue instead of hunting for it. On average, offices collect roughly $65,000 more per location after adopting the platform, which is a reasonable estimate of what this glossary costs a practice that has never gone looking.
Revenue leakage FAQ
What is revenue leakage in a dental practice?
The gap between revenue legitimately earned and revenue actually collected: money for delivered care lost through small, preventable failures across the revenue cycle rather than one big event. Common sources include unworked denials, underpayments, timely filing write-offs, and patient balances that age out.
How do you measure revenue leakage?
Start with net collection rate, the share of collectible revenue actually collected. Above 98% is healthy, and the common range is 92 to 95%. Every point below 100 represents leakage, and the supporting metrics, AR days, aging buckets, and denial rate, indicate which leak points are responsible.
Is revenue leakage the same as claim denials?
No. Denials are one source of leakage, and only leak revenue when they go unworked past their appeal windows. Underpayments, downcoding, unposted remittances, and aging patient balances all leak revenue without a denial ever occurring.
What is the most overlooked source of revenue leakage?
Underpayments. A paid claim looks finished, so short payments against contracted rates pass unnoticed unless someone reconciles payments to fee schedules. Timely filing write-offs miscategorized as contractual adjustments are a close second, because the loss is never counted as a loss.
Why is revenue leakage worse for DSOs than single practices?
Scale hides it. Blended metrics average clean offices against leaking ones, workflows drift by location, and no one person can see the whole picture. The same leak repeating quietly across twenty offices compounds into six or seven figures while every top-level number still looks acceptable.
Leakage is a list
The gap between what you produce and what you collect is this list, operating quietly: a handful of named, findable, fixable leak points, each with a place it hides and a warning sign it gives off. The practices that collect closest to what they earn are simply the ones that went looking.
Want to see where your group is leaking, broken out by location, payer, and leak point? See InsideDesk in action.