An AR aging report answers one question: how long has the money you are owed been sitting out? It takes your total accounts receivable and sorts every dollar into buckets by age, typically 0 to 30 days, 31 to 60, 61 to 90, and 90-plus. Read correctly, it is the single fastest way to spot where collections are slipping. Read as one big total, it tells you almost nothing.
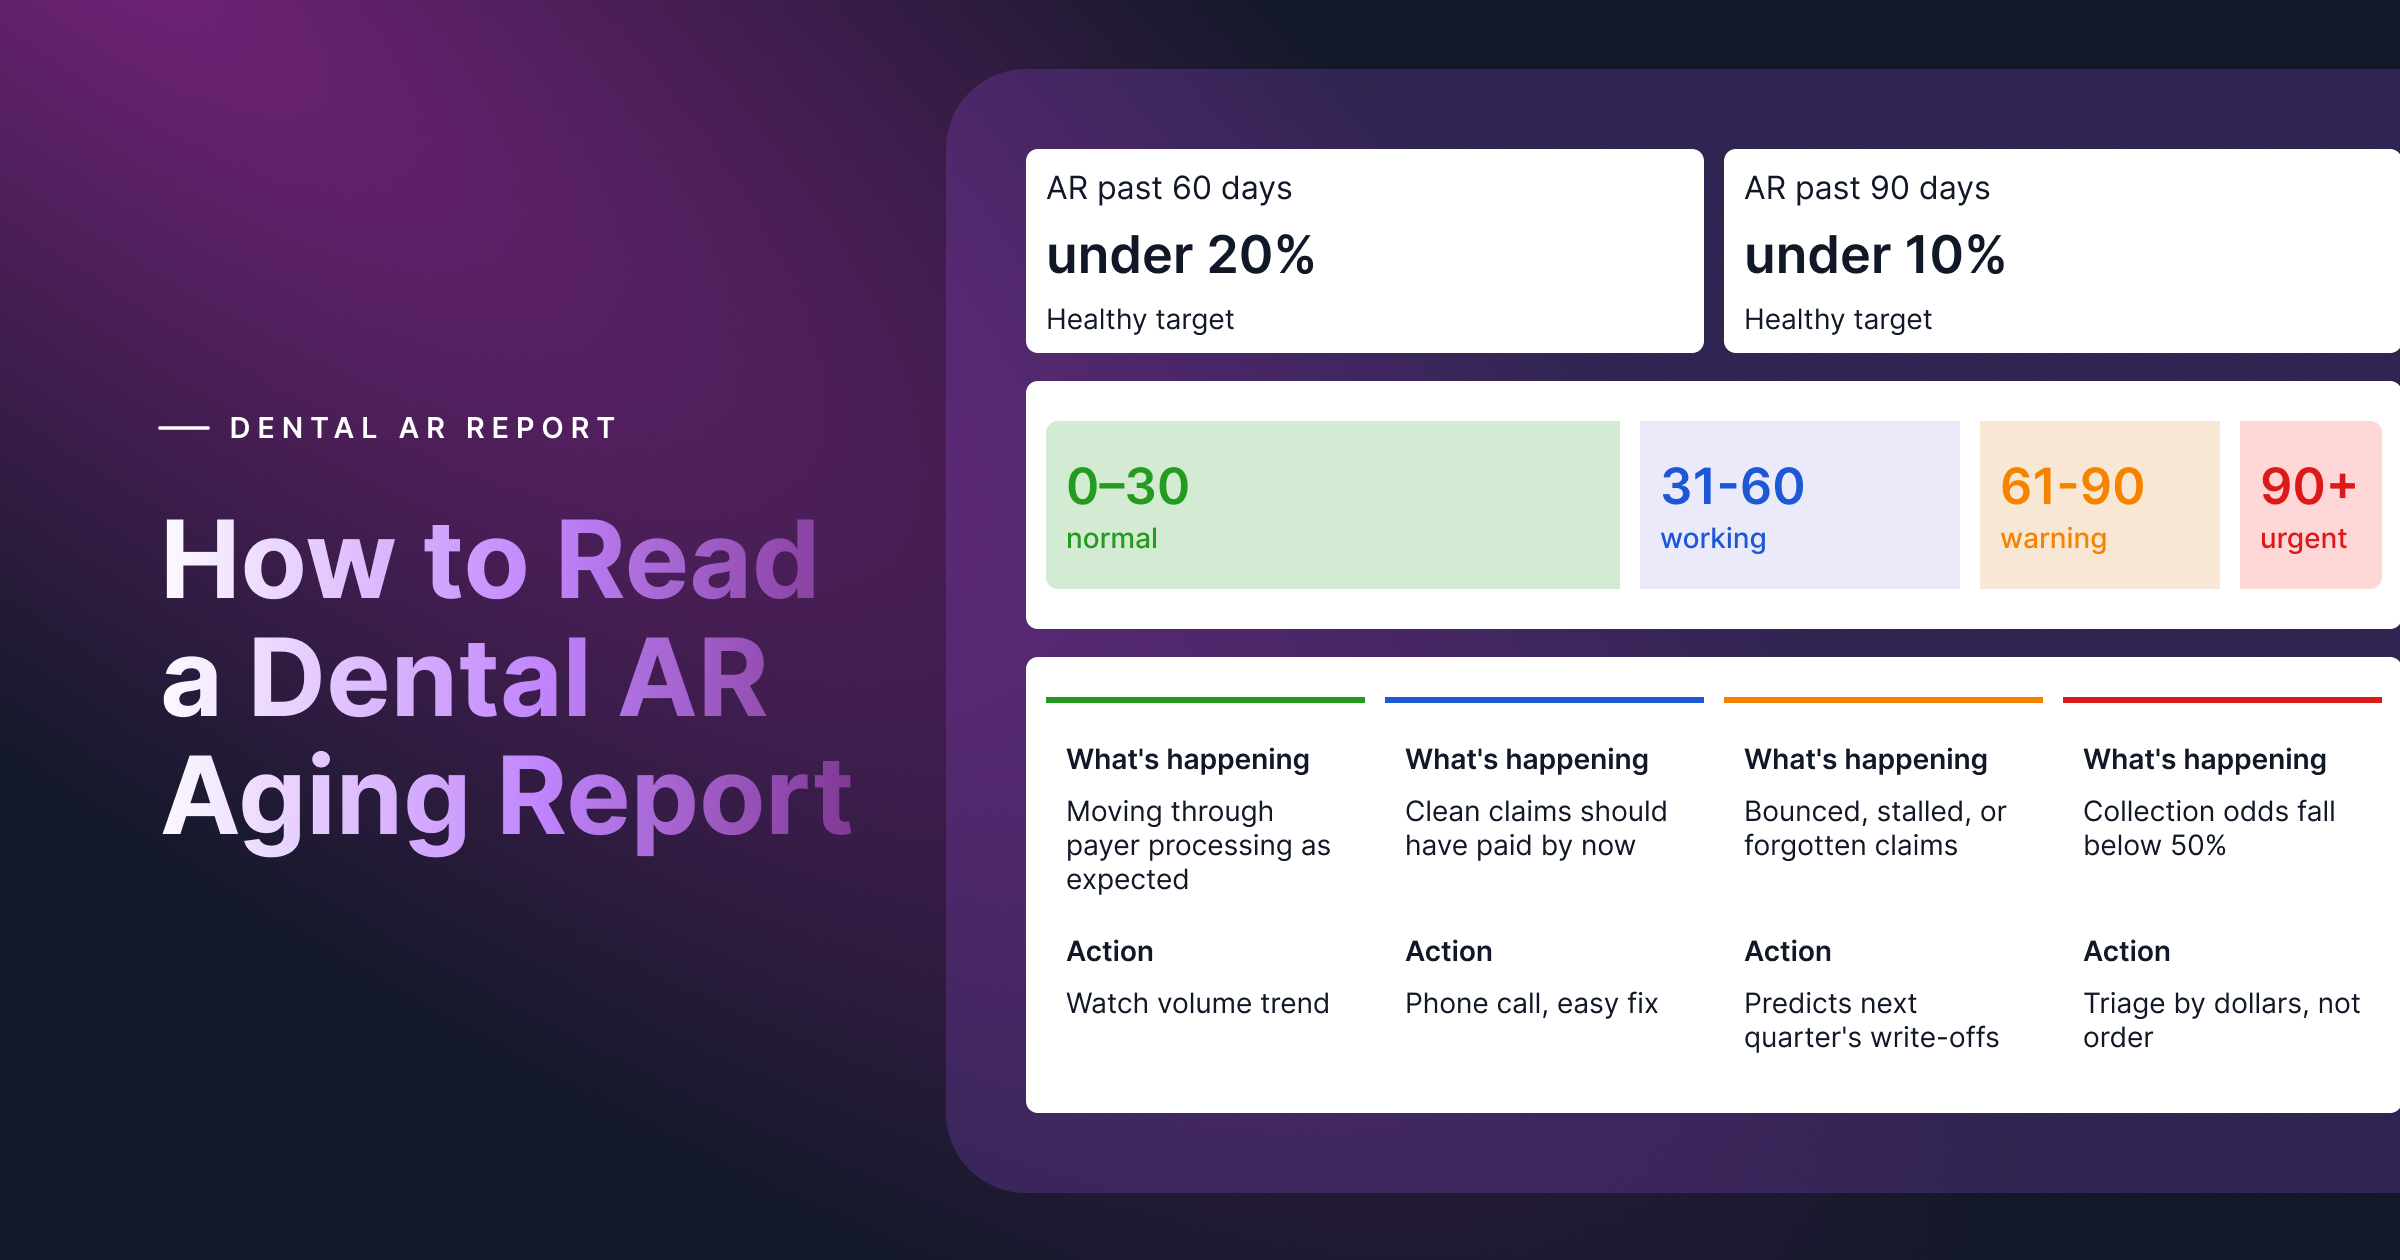
The short version: the 0 to 30 bucket is normal, the 31 to 60 bucket is where follow-up should be happening, the 61 to 90 bucket is your early warning, and the 90-plus bucket is the damage report. Healthy groups keep less than 20% of AR past 60 days and less than 10% past 90. Here is how to read the report bucket by bucket, the two numbers that matter most, and the five checks worth running every single time you open it.
What the report shows, and what it hides
The aging report is a snapshot: every outstanding balance, grouped by how many days have passed since the claim or statement went out. Most practice management systems will split it by insurance AR versus patient AR, by location, and sometimes by payer, and those splits are where the useful reading happens.
The report tells you how old the money is, not why it is stuck. It cannot distinguish a claim awaiting normal payer processing from one that was denied and forgotten. It can also mislead in both directions: unposted payments make AR look older and larger than it really is, while uncredited adjustments and patient credits sitting in the wrong place can inflate it. The report is the map, and the first rule of reading it is to make sure posting is current before you trust a number on it (a lagging posting process inflates every bucket, which is one of the quiet forces behind a rising AR days number).
The buckets
0 to 30 days: normal operations. Claims in this bucket are mostly doing what claims do: moving through payer processing. A large 0 to 30 bucket is what a healthy cycle looks like, since most of your AR should be here. Watch the volume trend rather than the number itself; a swelling current bucket with flat production usually means submissions are going out late.
31 to 60 days: the working bucket. By now, clean claims should largely have paid. What remains here needs a status: pending, requesting information, denied, or slow. This is where active follow-up is needed, because everything in this bucket is still easy to fix. A claim worked at day 40 is a phone call, where the same claim at day 100 is an appeal.
61 to 90 days: the early warning. These claims have bounced, stalled, or been forgotten, and every day they sit, their 30-to-90-day appeal windows get shorter. This bucket predicts next quarter's write-offs, which is why it's the one to watch: the money here is still recoverable, and the pattern of what lands here shows you where follow-up is leaking.
90-plus days: the damage report. Collection odds fall below 50% past 90 days, and every claim here is either racing a deadline or has already missed one. Triage this bucket by dollars and deadlines, not top to bottom. Also, remember what you're actually looking at: problems that started 60 to 90 days ago, further up the report.
The two numbers that matter
The two most important readings from the report are the percentage of AR past 60 days, and the percentage past 90. Healthy groups hold those under roughly 20% and 10%, respectively. Those two ratios compress the report into a health check, and they are more difficult to fool than the total AR figure, which can look stable while quietly aging underneath.
The more advanced reading is movement. Compare this month's buckets to last month's and watch the flow: how much of the 31 to 60 bucket slid into 61 to 90 instead of resolving? That slide rate is your follow-up process measured in dollars. A report where balances mostly resolve out of the working bucket describes a team in control; a report where balances mostly age forward describes a team discovering problems late.
Five checks to run when you open the report
1. Split insurance AR from patient AR first. They age for different reasons and get fixed by different people. Insurance AR aging past 60 points at claim follow-up; patient AR aging past 60 points at statements, estimates, and payment options. Blending them hides both.
2. Read the past-60 and past-90 percentages against targets. Under 20% and under 10%. Two numbers, ten seconds, and you know whether the rest of the reading is a routine check or an investigation.
3. Compare every bucket to last month. A snapshot ages well only next to another snapshot. The question is never just “how much is past 60” but “is past-60 growing,” because a growing bucket at a flat production level means follow-up is losing ground.
4. Sort the old buckets by dollars and payer, not alphabetically. Ten claims usually explain most of the 90-plus bucket, and they cluster the same payer, the same procedure, and the same office. Sorting by value and deadline turns an overwhelming list into an afternoon of targeted work.
5. Check for distortions before drawing conclusions. Unposted payments, unapplied credits, and stale small balances all skew the picture. If the posting backlog is a week deep, the report is describing last week's problems as this week's aging.
What good looks like on an aging report
Reading it at DSO scale
Everything above gets harder, and more important, across a group. A blended aging report rolls fifty locations into one set of buckets, and the offices running clean cancel out the offices in trouble, exactly the way a blended AR days number does. The readable version of a group report is broken out by location and by payer, so a 90-plus bucket concentrated at two offices with one payer shows up as the specific, fixable problem it is instead of disappearing into the average.
That per-location, per-payer view is the reading this whole post is really about, and producing it by hand across a dozen practice management systems is its own job. It is the visibility InsideIQ was built to give operations and RCM leaders: AR aging broken out across every office in real time, with benchmarking against 1,200+ supported DSOs, so the report reads itself and the team spends its time on the claims instead of the spreadsheet.
Dental AR aging report FAQ
What is an AR aging report in dental billing?
A report that sorts every outstanding balance, insurance and patient, into buckets by how long it has been owed, typically 0 to 30, 31 to 60, 61 to 90, and 90-plus days. It shows where money is waiting and for how long.
What percentage of dental AR should be over 90 days?
Healthy groups keep it under roughly 10% of total AR, with less than 20% past 60 days. Collection odds fall below half once receivables pass 90 days, so a growing 90-plus bucket is revenue actively turning into write-offs.
Which aging bucket matters most?
The 61 to 90 bucket is the most valuable early warning: everything in it went wrong recently enough to still be recoverable, and its size predicts next quarter's write-offs. The 90-plus bucket matters as triage, but it records problems that started months earlier.
How often should a dental practice review its AR aging report?
Working teams touch it weekly to drive follow-up priorities, and leadership reads it monthly against the prior month to watch movement between buckets. Anything less frequent means discovering problems after appeal windows have started closing.
Should insurance AR and patient AR be aged separately?
Yes. They age for different reasons and are fixed by different workflows: insurance aging points at claim follow-up and denials, patient aging points at estimates, statements, and payment options. A blended number hides which problem you actually have.
The report is a map of where money waits
An aging report will not fix anything on its own, but read the right way, weekly, split by type, sorted by dollars, compared to last month, it tells you where to send your team's limited hours. The groups that stay healthy are the ones who caught the slide from the working bucket into the warning bucket while it was still a phone call instead of an appeal.
Want your AR aging broken out by location and payer automatically, with the problem buckets surfaced for you? See InsideDesk in action.