Contact Us Today! - 855-777-0801 - [email protected]

InsideAssist Icon

InsideIQ

AR Performance Analytics Built For DSOs

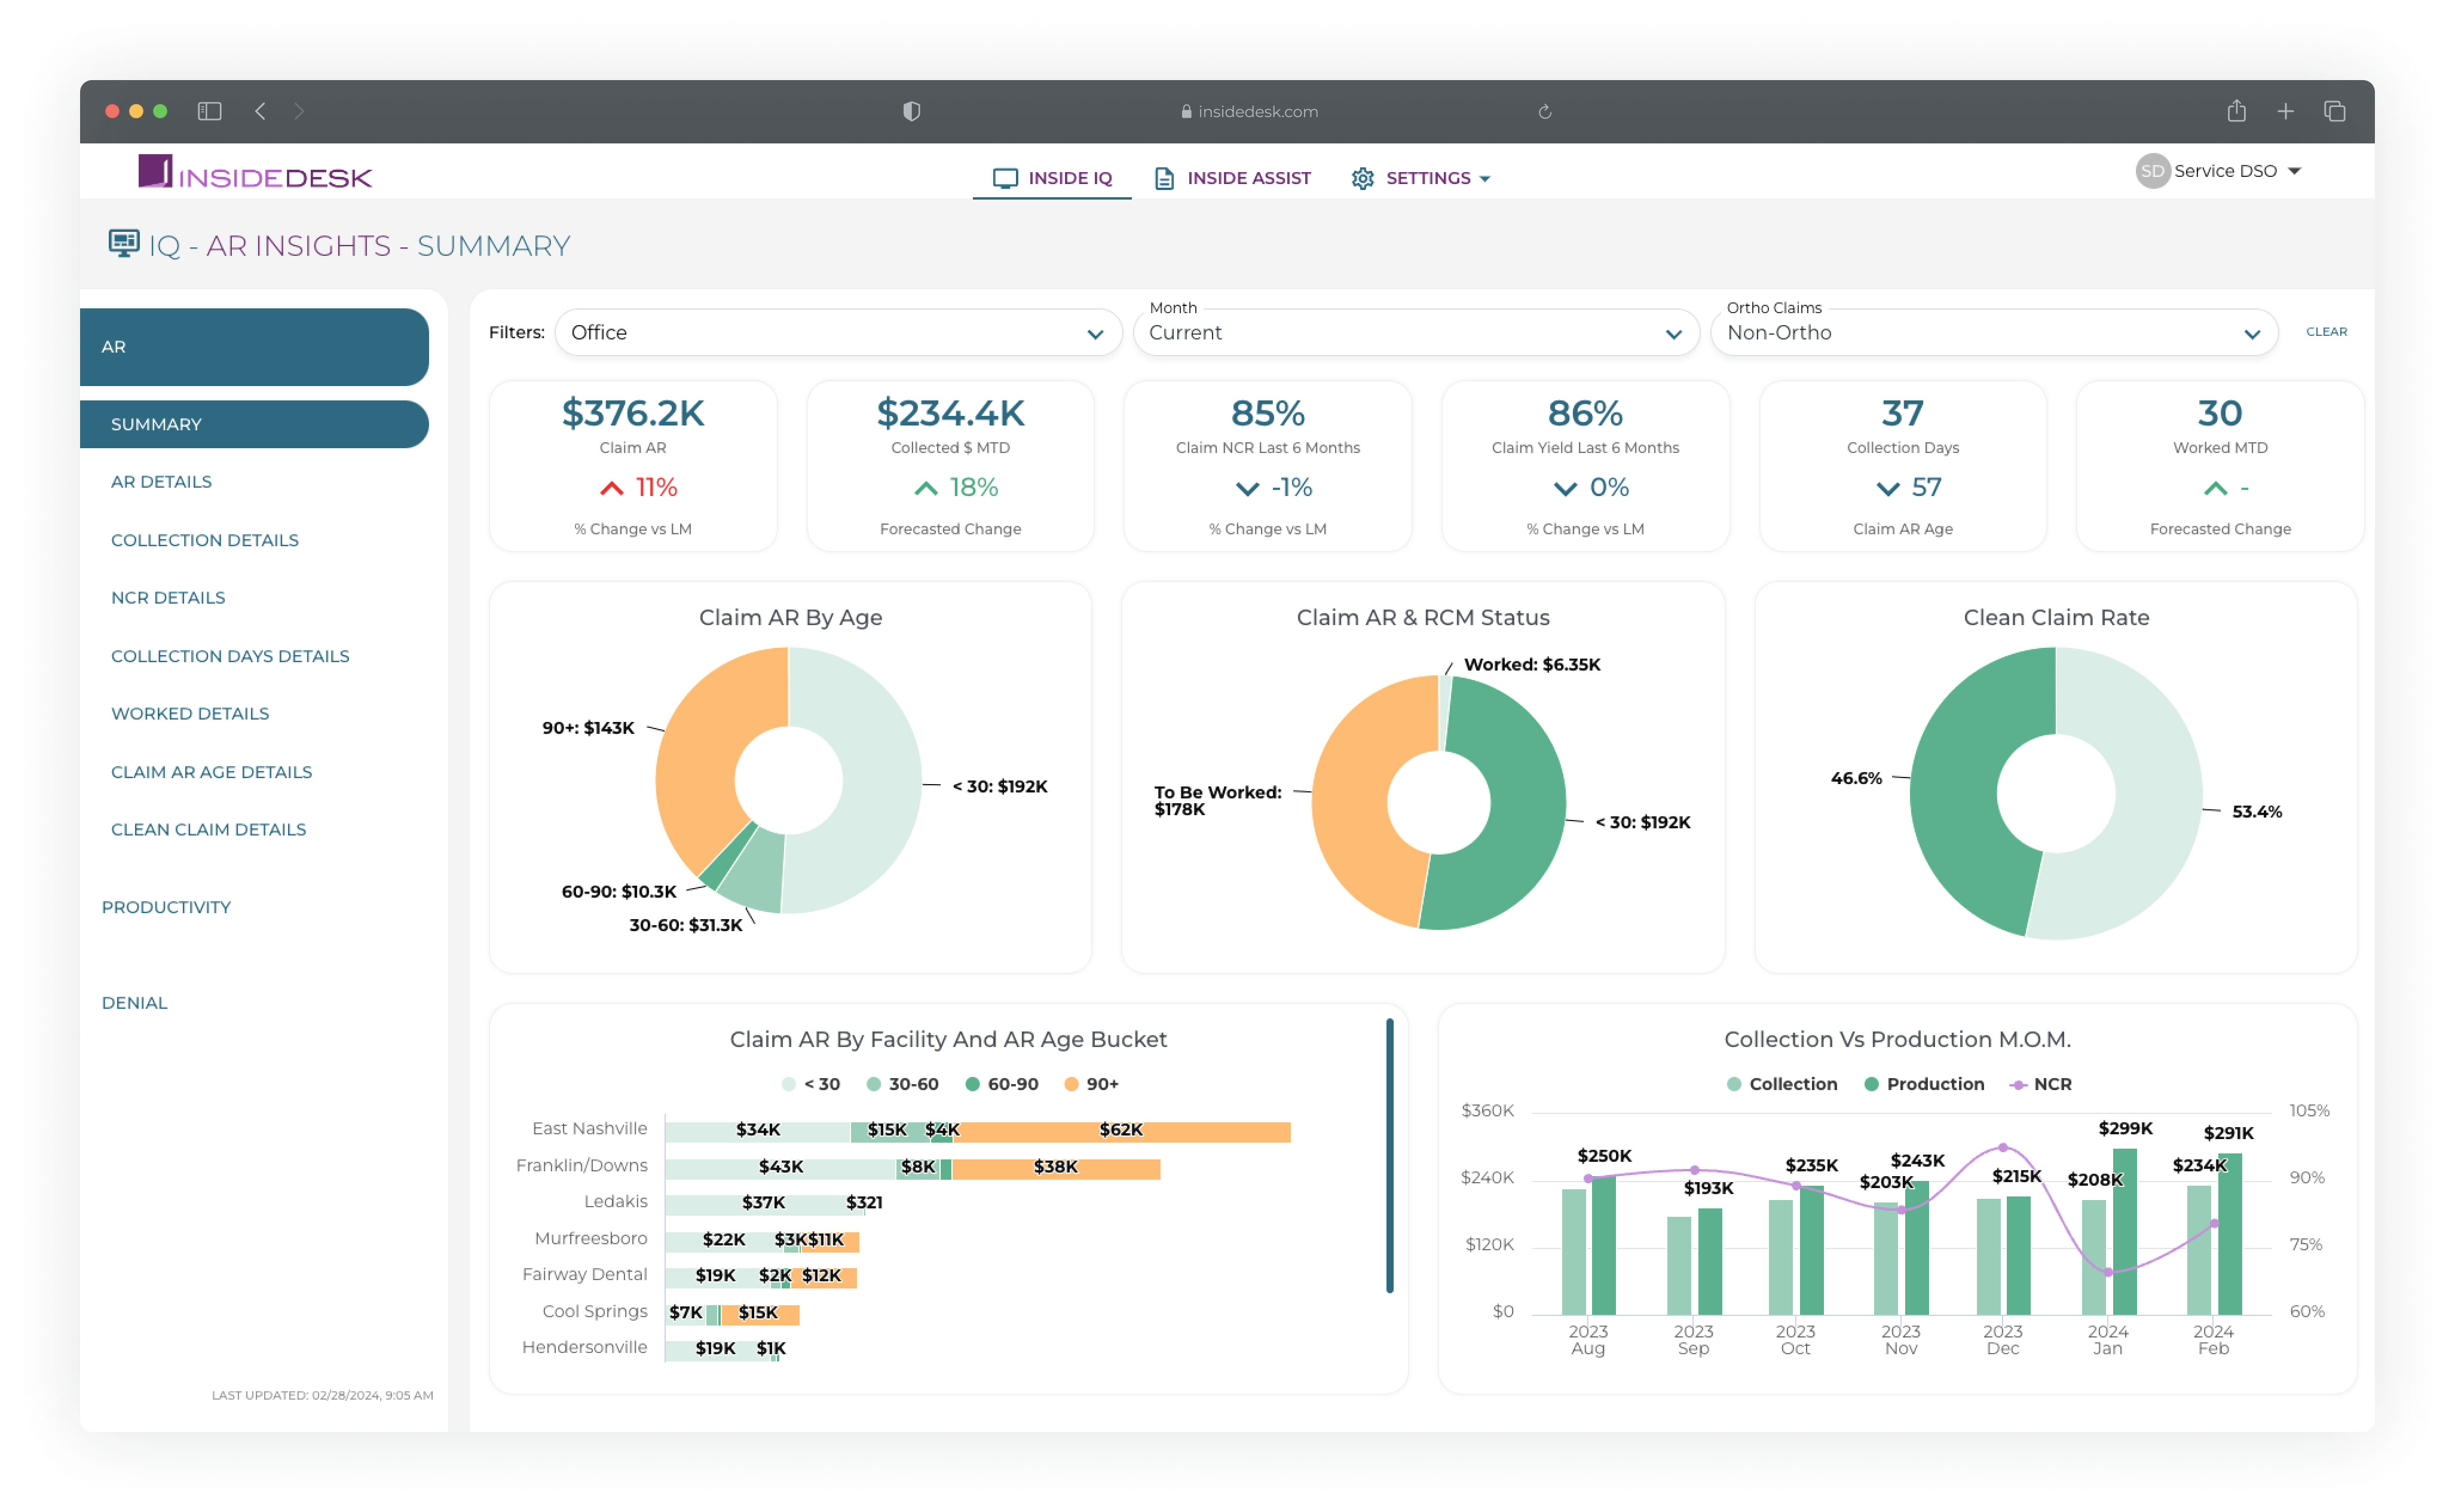
InsideIQ delivers in‑depth Payer AR reporting and benchmarking tailored for DSOs. Offering daily updates, industry-aligned metrics, and drill‑down data filters, it helps leadership understand and act on financial health across offices, turning raw data into data-driven insights.

Dashboard

TRUSTED BY THE FASTEST-GROWING AND LEADING DSOS

Brand Image
Brand Image
Brand Image
Brand Image
Brand Image
Brand Image
Brand Image
Brand Image
Brand Image
Brand Image
Brand Image
Brand Image
Brand Image
Brand Image
Brand Image
Brand Image
Brand Image
Brand Image
Brand Image
Brand Image
Brand Image
Brand Image
Brand Image
Brand Image
Brand Image
Brand Image
Brand Image
Brand Image

Say goodbye to spotty data
and bad reporting

You no longer have to deal with spreadsheets, delayed reports, and a lack of context. InsideIQ centralizes all your payer, PMS, and team performance data into a single command center that’s updated daily and built to scale with your DSO.

Benefits Icon

Spot revenue leaks and denial trends early

Benefits Icon

Benchmark performance across offices and payers

Benefits Icon

Measure team productivity with metrics that matter

InsideIQ provides clarity and visibility into financial health, enabling DSOs to scale with smarter insights

Hero Card
Hero CardHero Card
Faq Icon
Real-time financial visibility
Benchmark industry performance
Faq Icon
Uncover revenue leaks
Faq Icon
Higher team productivity & accountability
Faq Icon

How InsideIQ Works

InsideIQ Screenshot
InsideIQ Screenshot

1.

InsideIQ ingests live data from PMS, work-event logs and EOBS.

2.

Get a real-time view of AR aging, clean-claim rate, collection speed, and cash-flow KPIs across your offices or filtered by a specific office.

3.

Each claim touch is tagged to a user, letting you see touches posted within 30 days, and dollars collected.

4.

Assigns every denial a category and dollar amount, then stack-ranks offices by worst offenders

5.

After you fix a process, track denial rate and collection speed lines move in the dashboard to prove ROI and keep teams accountable.

The features you need to measure what matters most

Daily Metrics Dashboard
Faq Icon
Trendline Insights
Faq Icon
Drill-Down Reports
Faq Icon
Daily Sync
Faq Icon
Benchmarking Tools
Faq Icon
Custom Filters
Faq Icon
Data Aggregation
Faq Icon
Denial Reporting
Faq Icon

Integrate with the systems and tools that you use to power your business

Works seamlessly with your existing PMS, requiring no changes to your workflow. Data integrates with Power BI or your existing reporting suite.

You solved half the battle…being able to automate EOB collection accurately and provide the claim status. I think it’s awesome not only from a workflow standpoint, but an efficient one for my staff too. It’s always easier when you put things in one place, and you don’t have to jump around into a million different portals.”

Author Image

Tammy Noah

Senior Director of Central Services at MB2

68%

Growth in 3 months

139k

Active Users