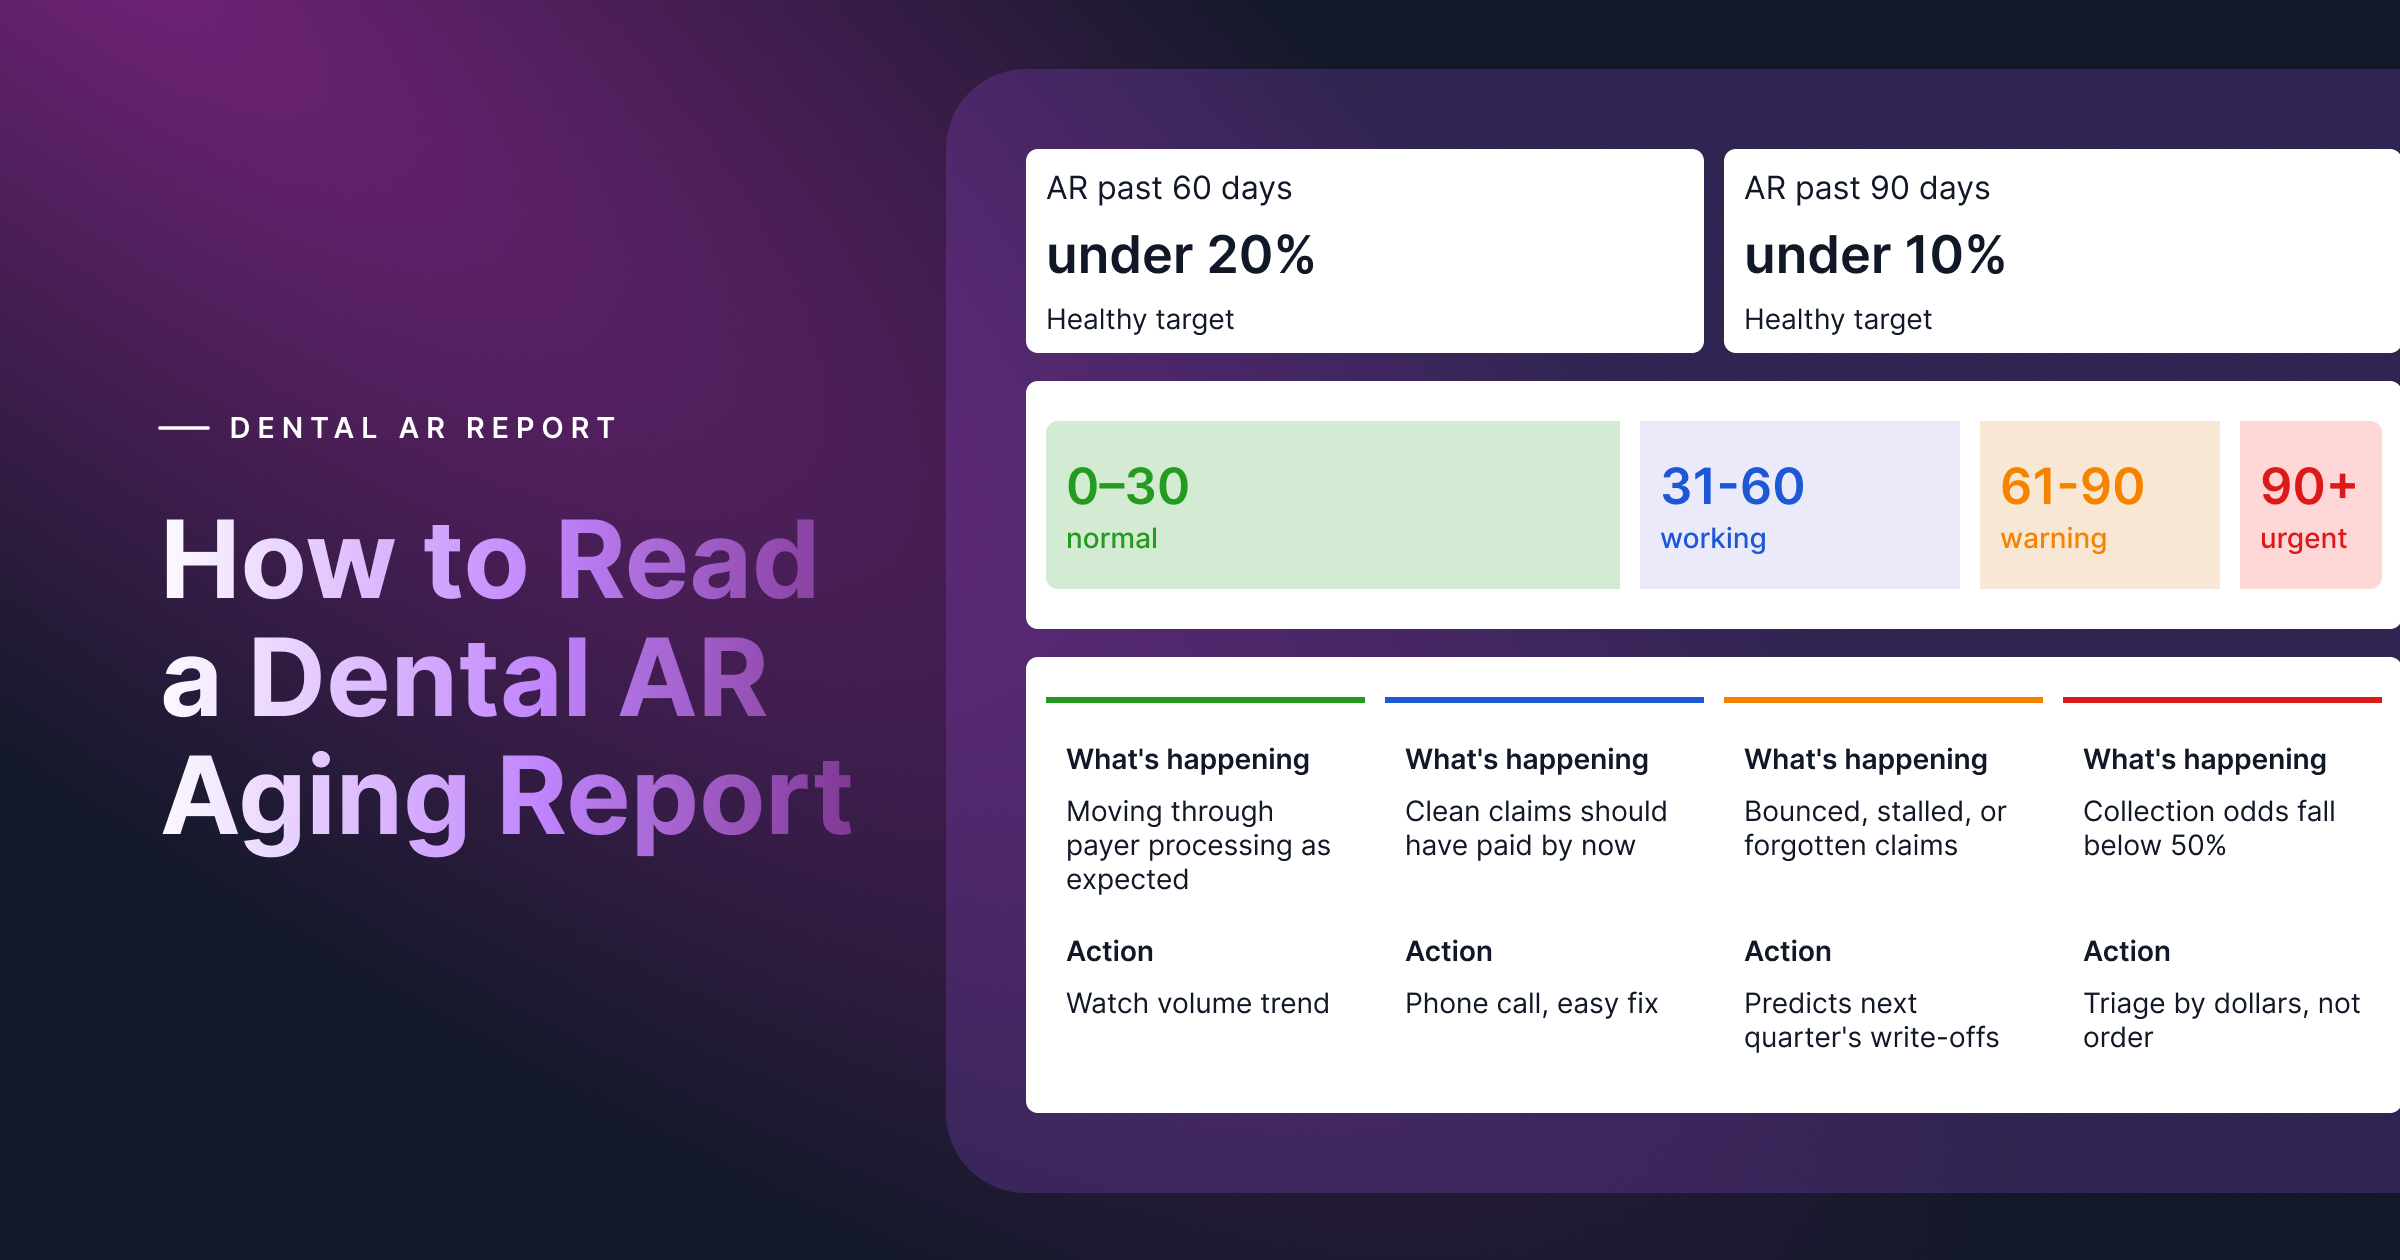
A good AR days number for a DSO is under 30. Sit in the low 30s and you are in workable shape but leaving cash on the table; drift toward 40 or higher and money is getting stuck somewhere in the cycle. A rising number rarely means patients stopped paying, it means revenue is piling up after the claim goes out while everyone waits.
For a DSO, the headline number hides more than it reveals. Your blended AR days figure is one of the least useful numbers you track, and the information you can act on sits underneath it. This post covers what AR days really tell you, why a single portfolio number misleads a group, and the levers that move it in the order they pay off.
A quick definition and the formula
AR days, or days in accounts receivable, is the average time it takes to collect a dollar after you have billed for the work. Lower means cash is arriving quickly. Higher means revenue is sitting in accounts receivable instead of in your bank account.
AR days = total accounts receivable ÷ average daily production
where average daily production is your production over a recent time interval divided by the number of days in it. A quick example: if your total AR is $360,000 and you produce $12,000 a day on average, your AR days are 30. Cross $480,000 in AR at the same production and you are at 40, which is where idle time in AR starts costing you real money.
One caution at the group level: define production the same way at every location. If one office measures it gross and another nets out adjustments, you are comparing numbers that were never calculated the same way, and the comparison is not correct.
As a directional read, under 30 is healthy, the low-to-mid 30s is workable but improvable, and sustained readings in the 40s almost always point to a specific, fixable bottleneck rather than a collections-wide failure. Watch the trend month over month; a single snapshot tells you little on its own.
Why one AR days number can mislead a DSO
Picture two offices that both report 34 AR days. On paper they look identical. Underneath, one collects nearly everything inside 30 days with a small, stubborn tail of old claims, while the other is carrying a stack of claims past 90 days that a few fast-paying payers happen to offset. Same number, very different problems, very different fixes.
That is the trap in a blended figure. Roll fifty locations into one dashboard tile and the offices running clean cancel out the offices in trouble. You manage to an average while the real damage hides in the spread.
So for a DSO, the number worth watching is not the portfolio average. It is the distribution underneath it. The distribution outlines which locations sit outside your target, how much of your AR is parked in the 60-plus and 90-plus day buckets, and which payers are dragging specific offices down. Breaking AR days out by location, by aging bucket, and by payer is what turns a vanity metric into something you can act on. That is the visibility InsideIQ is built to give DSO leaders, showing AR aging and performance across every office instead of flattening it into one number.
How to lower days in AR
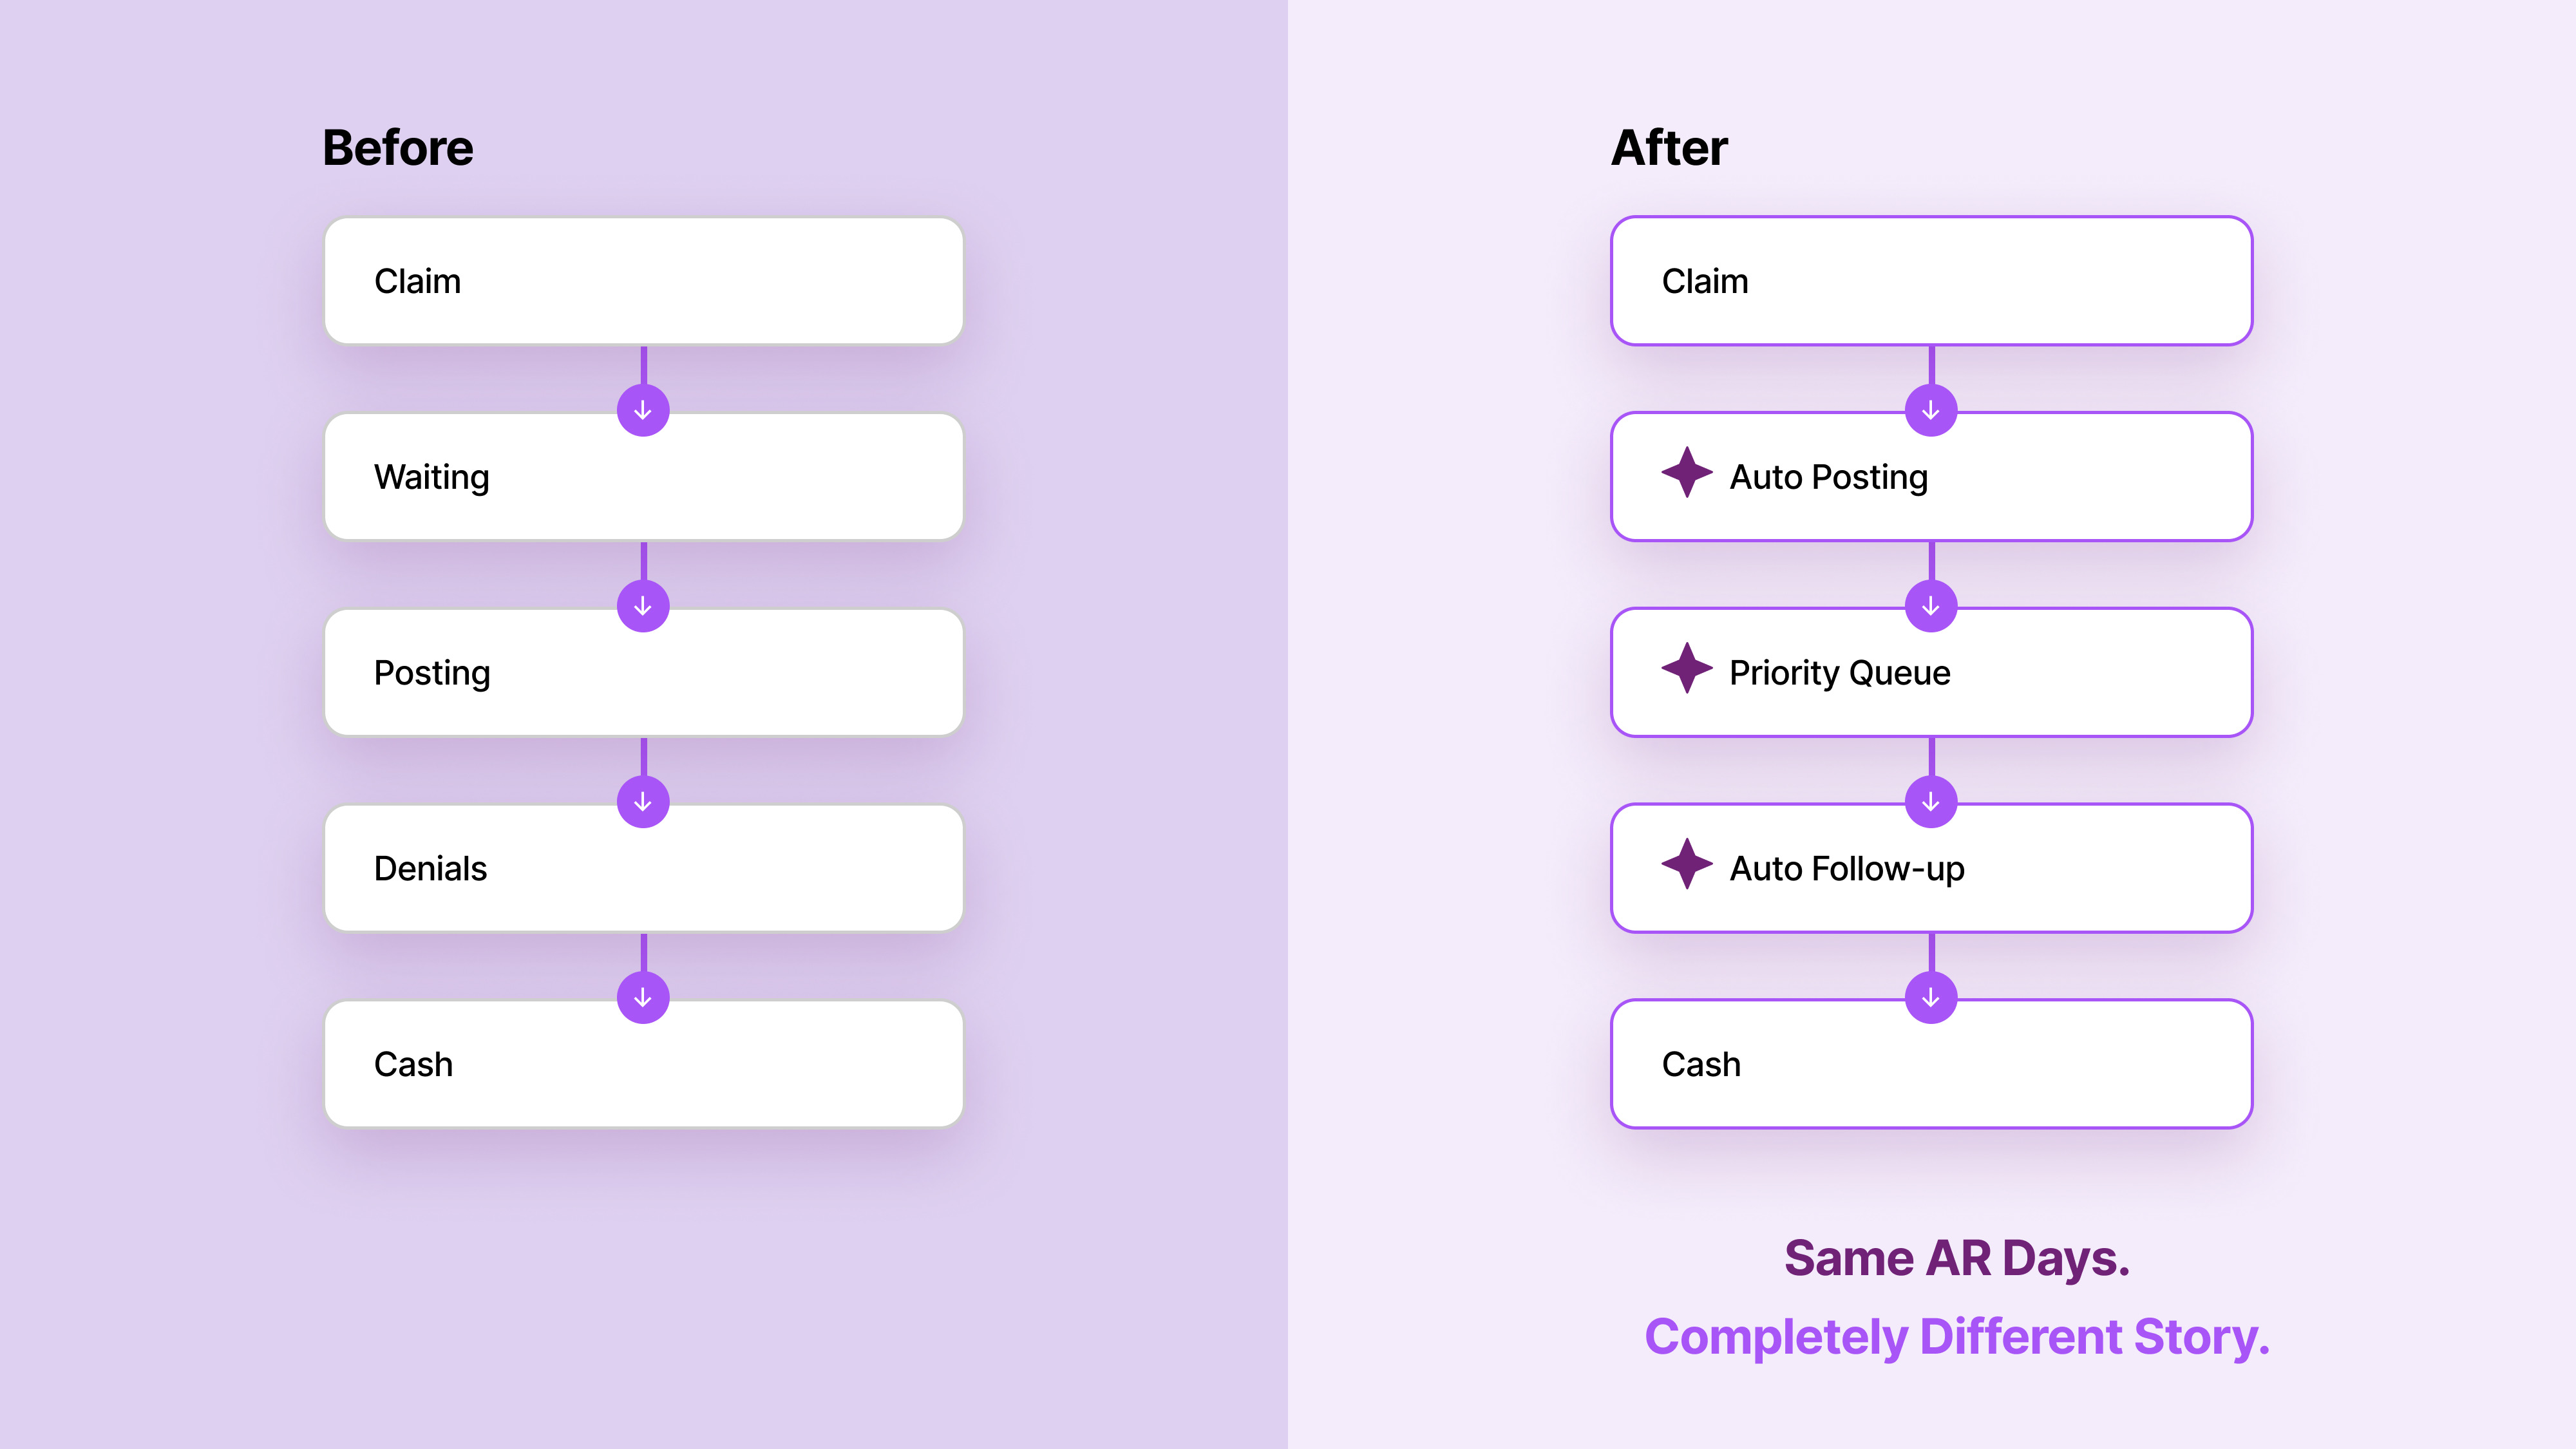
Most AR days advice points at the front of the cycle: verify eligibility, submit cleaner claims. That work matters but for most DSOs the days do not pile up at the front, they pile up at the back after the claim has gone out while everyone waits. When piling up at the back it helps to then work backward from where the time actually accumulates.
Post what has already been paid. The most overlooked cause of high AR days is not slow payers, it is slow posting. When EOBs and ERAs sit unposted, your AR looks inflated even though the money has effectively arrived. Closing that gap with automated, EFT-matched posting like InsideRemit does, often pulls the number down before you have changed anything about how claims are worked.
Work the right claims, not every claim. A biller who opens the oldest tab and grinds down the list is busy, but not effective. The claims that move the number are the ones with the most dollars at risk and the nearest deadlines. Surfacing those first using a tool like InsideAssist, puts the next best action in front of the team instead of a raw queue, sends your team’s limited hours to the claims that shorten AR.
Stop letting payers set your pace. A large share of back-end time is simply waiting on hold, in portals, or for a status that should take seconds. Automating the payer chase so claim status and denial reasons come back without a person stuck on the phone, which is what InsideDial handles, collapses the dead time between submitted and resolved. That dead time is pure AR days.
Beat the appeal clock on denials. A denied claim ages fast, and some payer appeal windows are as short as a month. The gap between working a denial this week and next month is often the gap between recovering the money and writing it off. Catching denials early, sorted by reason and by payer, keeps recoverable revenue from quietly turning into bad debt.
Make it boringly consistent everywhere. Any single office can hit a good number in a good month. The DSO challenge is hitting it in every office, every month, as staff turn over and habits drift. Standardized workflows and one shared view of performance keep your best location’s number from being a happy accident, and your worst location’s number from being a surprise.
The throughline is simple: high AR days is mostly a back-office speed problem, and speed comes from removing manual waiting, not from asking your team to work longer hours. AR days is also one link in the larger cycle; if you want the full claim-to-collection picture it sits inside, our 12-step dental RCM checklist walks every step from booking to bank.
What good looks like at scale
A good AR days number for a DSO is under 30. The better goal is a tight, predictable distribution with every location in range, very little money sitting past 60 days, and no single payer or office quietly dragging the portfolio down. As a rule of thumb, most healthy groups operate at these targets:
AR days for DSOs: FAQ
What is a good AR days number for a DSO?
Under 30. The low 30s is workable but improvable, and sustained readings in the 40s signal a specific, fixable bottleneck. For a group, the target applies to each location, not just to the blended average.
Why can a blended AR days number be misleading for a DSO?
Because a healthy office and a struggling one can average out to the same figure. The portfolio number hides the spread. What is actionable is the distribution: AR days by location, by aging bucket, and by payer.
What is the single fastest way to lower AR days?
Usually faster payment posting. Unposted EOBs and ERAs inflate AR even after the money has effectively arrived, so automating posting often drops the number before anything else about claim work changes.
How are AR days different for a DSO than for a solo practice?
A solo office can hit a good number on habit. A DSO has to hold it across locations as staff turn over, which depends on standardized workflows and cross-office visibility rather than individual effort.
How quickly can a DSO lower its AR days?
Posting and prioritization changes can move the number within a billing cycle or two. The durable gains come from running the same follow-up workflow consistently in every office.
The number under the number
AR days is one of the clearest reads on how fast a group turns production into cash, but for a DSO the average is only the headline. The story is in the distribution telling which offices are in range, how much is aging past 60 and 90 days, and which payers are slowing specific locations down.
The groups that consistently stay ahead share the same habits. They post the day money lands, follow up in priority order, refuse to wait on payers, and run one playbook in every office. That is how InsideDesk customers collect meaningfully faster without adding headcount.
Curious where your AR days are really sitting, location by location? See InsideDesk in action.