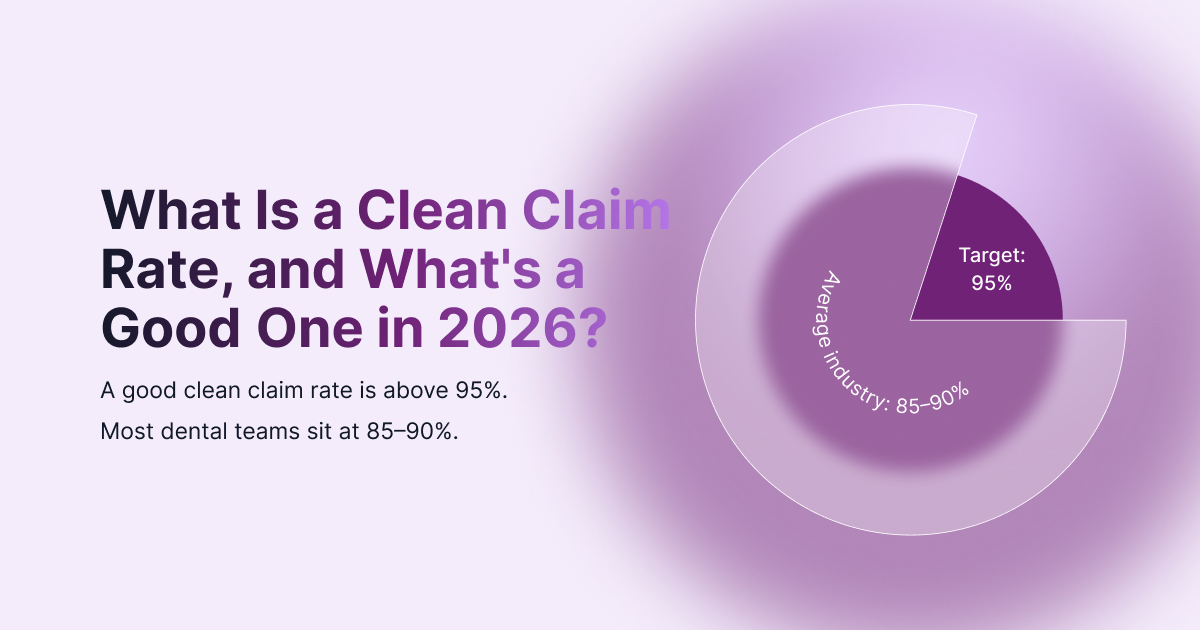
A clean claim is one that gets accepted and paid on the first submission, with no rejections, no requests for more information, and no manual rework. Your clean claim rate is the share of claims that make it through on that first pass. A good clean claim rate in 2026 is above 95%. Most dental practices and DSOs sit closer to 85 to 90%, and that gap is more expensive than it looks.
Every claim that bounces gets touched twice: once to submit it, and again to figure out why it came back, fix it, and send it out into the queue once more. Multiply that across hundreds of claims a month and dozens of locations, and a few percentage points of clean claim rate quietly become one of the largest hidden labor costs in your revenue cycle. This post covers what the metric really measures, what a healthy number looks like now, and the levers that raise it in the order they pay off.
A quick definition and the formula
Clean claim rate, sometimes called first-pass acceptance rate, is the percentage of claims accepted and processed on the first submission without any edits, rejections, or manual intervention.
Clean claim rate = claims accepted on first submission ÷ total claims submitted × 100
A quick example: if your group submits 1,000 claims in a month and 880 of them go through without being touched again, your clean claim rate is 88%. The 120 that came back are where the rework, the delay, and a meaningful share of your denials live.
One caution at the group level: define “clean” the same way at every location. Some teams count a claim as clean once it clears the clearinghouse, others only once the payer accepts it without intervention. Both are defensible, but if two offices measure differently, you are comparing numbers that were never calculated the same way, and the comparison is not correct.
What is a good clean claim rate in 2026?
Above 95% is the target high-performing groups hold. The common industry range is 85 to 90%, which is workable but leaves real money in rework, and sustained readings below 85% almost always point to a specific breakdown at the front of the cycle rather than bad luck with payers.
The benchmark itself has not moved much, but the environment around it has. Payers are automating more of their adjudication, which means imperfect claims are caught faster, in higher volume, and with less human discretion than before. A claim that might once have slipped through now comes back as a rejection. The groups pulling ahead in 2026 are the ones matching that automation on their own side of the fence, catching the errors before the payer does instead of after.
Why one blended number misleads a DSO
Picture two offices that both report 90%. On paper they look identical. Underneath, one has a small scatter of random intake errors, while the other has a single payer rejecting the same missing attachment forty times a month. Same number, very different problems, very different fixes.
That is the trap in a portfolio average. Roll fifty locations into one dashboard tile and the offices running clean cancel out the offices in trouble. The number worth watching is not the blended rate, it is the distribution underneath it: clean claim rate by location, by payer, and by rejection reason. One recurring payer rule failing at one office is a one-hour fix that recovers points of clean claim rate. You can only make that fix if you can see it. That visibility is what InsideIQ is built to give DSO leaders, breaking first-pass performance out across every office instead of flattening it into one number.
What a low clean claim rate actually costs
A rejected claim costs you three ways. It costs staff time, because someone has to research it, correct it, and resubmit it. It costs speed, because every bounce adds days between treatment and payment, which is how a soft clean claim rate quietly inflates your days in AR. And it costs revenue outright, because a share of rejected claims never get resubmitted at all. They sit in a work queue until they age past timely filing limits and become write-offs for care you already delivered.
That is why clean claim rate is one of the highest-leverage numbers in the cycle. It sits upstream of nearly everything else: raise it, and your denial rate, your AR days, and your team’s capacity all improve at the same time without collecting a single extra dollar of production.
How to raise your clean claim rate
Get intake right at booking. Most first-pass rejections trace back to a small slip at the front desk: a transposed member ID, an outdated address, the wrong subscriber on file. Accurate patient and subscriber details captured once at booking prevent hours of rework everywhere downstream.
Verify eligibility before the visit, not after. Confirm coverage is active and check frequency limitations, remaining maximums, and waiting periods before the patient is in the chair. Claims submitted against inactive or misunderstood coverage are among the most preventable rejections, and the most expensive to unwind after treatment.
Document and code the same day. Clinical notes and CDT codes are what the payer adjudicates against. Thin documentation or a single miscoded procedure invites a rejection or a downcode. Coding while the detail is fresh keeps the claim accurate and moving.
Scrub every claim against payer-specific rules. Attachments, narratives, X-rays, and tooth or surface detail requirements vary by payer. A claim checked against those rules before it leaves the building is cheaper than one that comes back, gets researched, and goes out again.
Track rejection reasons and feed them back to the front. Every rejection carries a reason, and those reasons cluster by payer, by location, and by procedure. Reviewing them monthly and fixing the recurring patterns at intake is how a clean claim rate climbs and stays up.
If those first four levers sound familiar, they should: they are the front half of the revenue cycle. Our 12-step dental RCM checklist walks the full claim-to-collection path they sit inside.
Clean claim rate benchmarks
Clean claim rate is easiest to read alongside its neighboring metrics, since the four move together. These are the ranges most commonly cited across dental practices and DSOs as healthy targets; treat them as approximate, since the numbers shift with payer mix and specialty.
How InsideDesk helps you see it, then raise it
You cannot improve a clean claim rate you can only see as a single blended number. InsideIQ gives revenue cycle leaders real-time visibility into first-pass performance, denial trends, and claim yield across every office, broken out by location, payer, and reason, with benchmarking against 1,200+ supported DSOs. That is what turns “our clean claim rate is 88%” into “this payer, at these three offices, for this attachment rule,” which is a problem a team can fix the same week.
And for the claims that do bounce, InsideAssist surfaces them with live statuses and a next best action, so rejections get corrected and resubmitted while the window is open instead of aging in a queue. Fewer claims bounce, and the ones that do get worked faster.
Clean claim rate FAQ
What is a clean claim in dental billing?
A claim that is accepted and processed by the payer on the first submission, with no rejections, edits, requests for additional information, or manual rework. It goes out once and gets paid.
What is a good clean claim rate in 2026?
Above 95%. The common industry range is 85 to 90%, and sustained readings below 85% usually signal a specific, fixable breakdown at intake, eligibility, coding, or claim scrubbing rather than a payer problem.
Is clean claim rate the same as first-pass acceptance rate?
They are used interchangeably in most dental settings. The important thing is consistency: decide whether “clean” means accepted by the clearinghouse or fully processed by the payer without intervention, and measure it the same way at every location.
What causes most claims to be rejected on the first pass?
The largest share trace back to the front end: inaccurate patient or subscriber details, eligibility not verified before the visit, incomplete documentation, coding errors, and missing payer-specific attachments or narratives. Most are preventable before submission.
How is clean claim rate different for a DSO than for a single practice?
A single office can watch one number. A DSO has to watch the distribution, because a healthy blended rate can hide one location or one payer generating most of the rejections. Improving at scale depends on standardized front-end workflows and visibility by office, payer, and rejection reason.
The cheapest claim is the one you only touch once
Clean claim rate is the clearest read on how much of your team’s effort turns into payment the first time, and how much gets spent doing the same work twice. The groups that hold 95% and above are not luckier with payers. Their front end is accurate, their claims are scrubbed against payer rules before submission, and their rejection reasons get fixed at the source instead of rescued one claim at a time.
Curious what your clean claim rate looks like by location and by payer, not just on average? See InsideDesk in action.