With multi-location scale and wide variation in payer contracts and technology infrastructures, managing the dental revenue cycle is uniquely complex for DSOs.
And yet, DSOs backed by private equity investors must maintain financial discipline.
Consulting firms such as PWC make it clear that PE stakeholders expect a defined growth framework built on data and strategy—not reactive financial management and decision-making. As Samantha Strain, partner and Chief Development Officer at HealthStream Ventures, tells Dentistry Today, “Buyers are conducting more rigorous due diligence than ever before.”
For DSOs with many offices and payers, RCM reporting is complex. Standardizing it creates a single source of truth that links payer outcomes, workflows, and collections, so leaders can track the right metrics and improve financial health and transparency.
Let’s cover which reports help your organization build unified platforms capable of managing massive data throughput across multiple systems.
What is RCM Reporting?
RCM reporting is the evaluation of your revenue cycle performance using reports and analytics built on the organization’s financial and operational data. They measure, analyze, and strengthen fiscal performance.
Many RCM teams still use spreadsheets, but leading DSOs are moving to AI-enabled platforms that integrate existing systems and deliver real-time insights with far less manual work.
These platforms unify revenue-cycle metrics so leaders can monitor cash flow, track trends, and quickly spot bottlenecks. RCM reporting pulls data from every stage—from registration and eligibility through coding, submission, and collections—to provide a complete view of performance.
In-house teams, billing partners, and software use these insights to resolve payer and workflow issues, accelerate cash flow, and reduce leakage.
The Benefit of Optimizing Your Dental Revenue Cycle Performance
For years, DSOs boosted cash flow by expanding their portfolios through new acquisitions. But with higher debt costs and declining reimbursements, DSOs have been prioritizing “same-store growth.” To wring more revenue and better cash flow from existing locations, the dental revenue cycle must be managed, analyzed, and even optimized.
Once regarded as a back-office function, RCM is now emerging as a lever to boost revenue realization, accelerate cash flow, and drive profitability.
How Young Family Dental Reduced AR and Avoided Bad Debt
Consider Young Family Dental, a 49-location DSO based in Dallas.
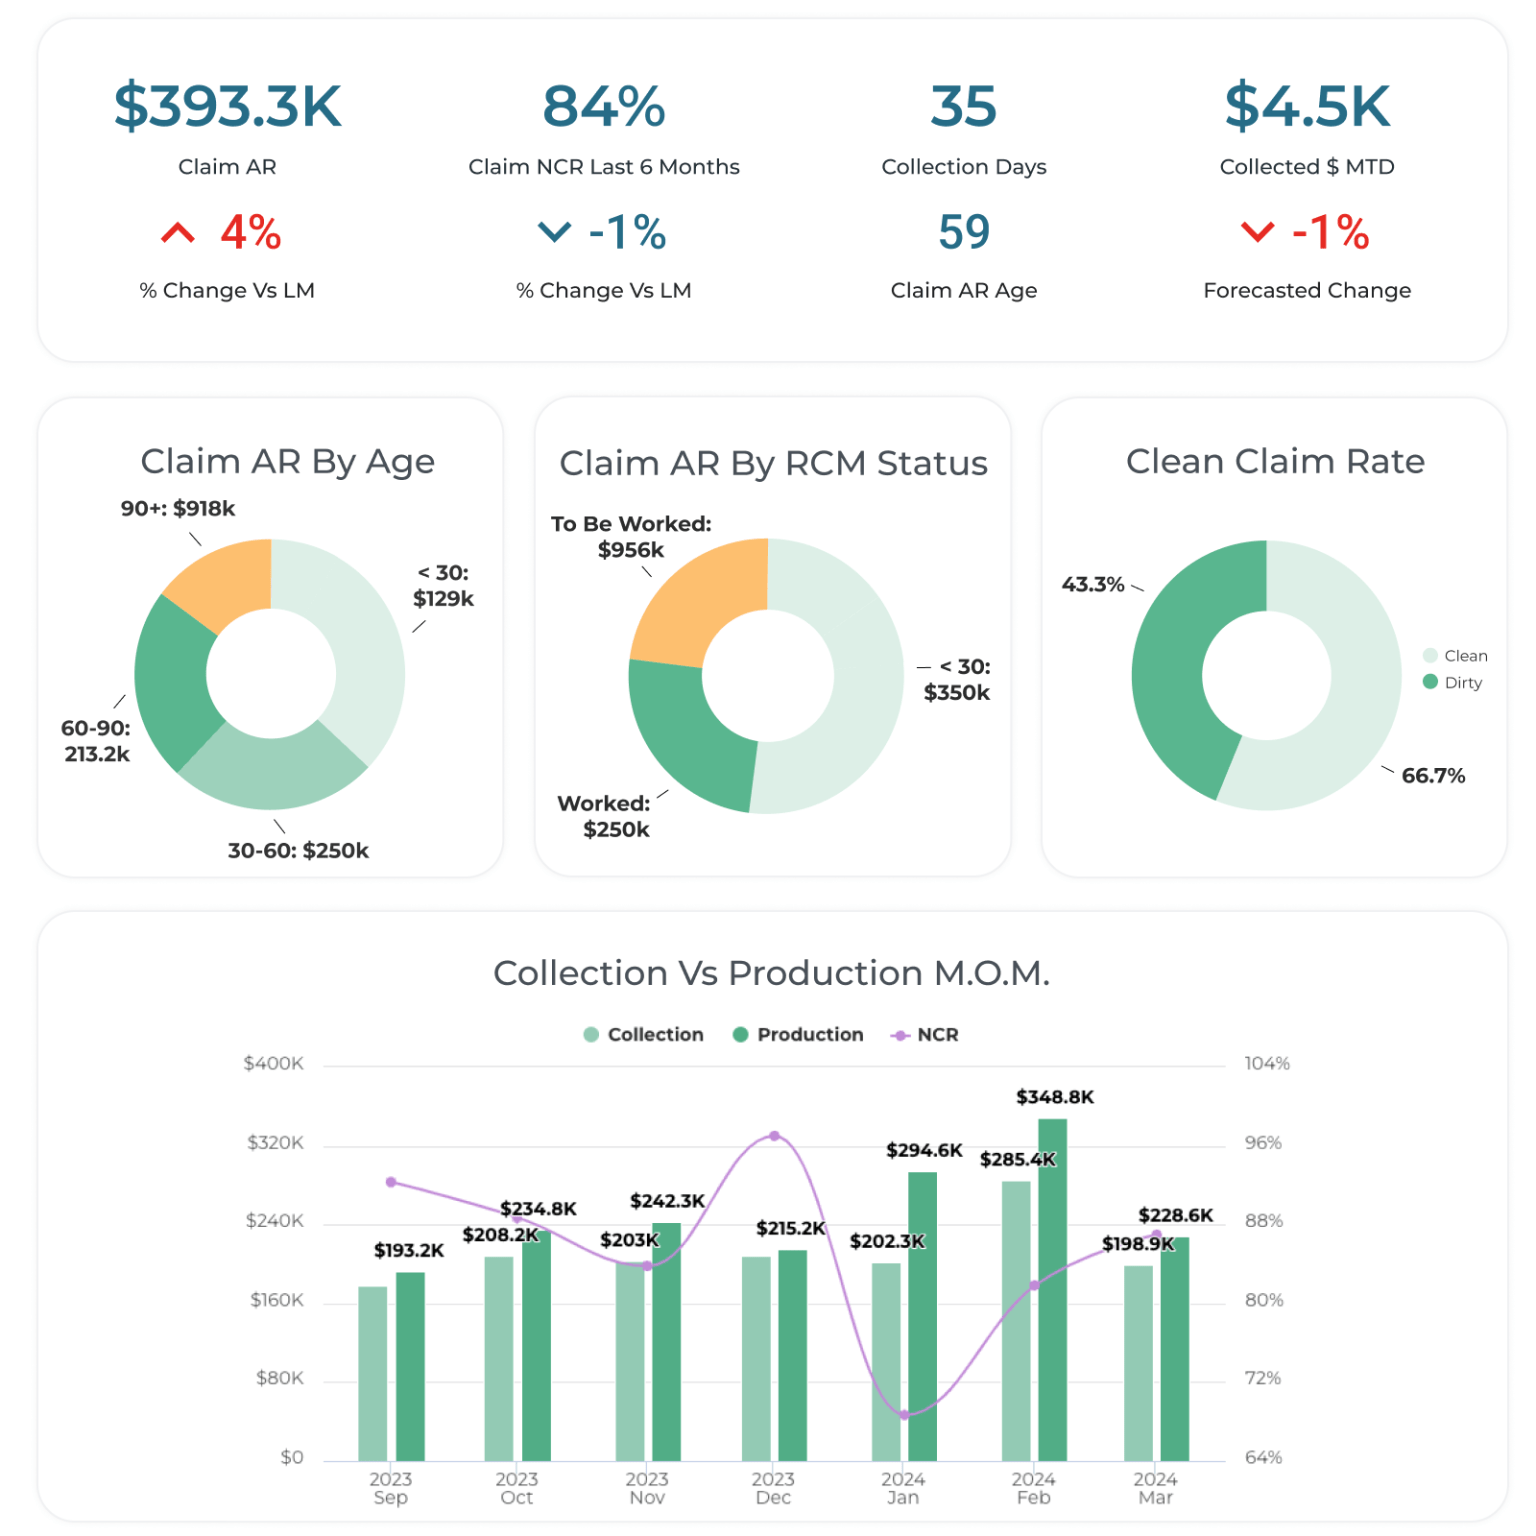
To address inefficiencies and a lack of visibility across multiple locations, the organization adopted RCM automation tools. Empowering staff with customizable RCM benchmarking and AR reporting, their leaders gained the clarity needed to address workflow bottlenecks and track revenue trends across multiple locations.
The organization also dramatically reduced claim resolution time while improving overall collections performance. By continuously tracking the DSO revenue cycle, Young Family Dental reduced AR, accelerated collections, and enhanced cash flow across its network.
Within five months, supported by its RCM reporting dashboards, the organization:
- Reduced total AR by $565,000, money that avoided bad debt write-off
- Reduced AR 90+ by $347,000
- Reduced days to collect from 44 to 24, increasing cash flow significantly
Revenue cycle optimization is dependent on reporting because it reveals inefficiencies, delays, and revenue leakage. With these trouble spots identified, RCM leaders can implement improvements and monitor progress via concrete numbers.
3 Types of Dental RCM Reports and the Metrics that Fuel Them
RCM reports connect operational performance to financial results. They help DSO leaders steer cash flow, payer mix, and bottlenecks through a single collections playbook.
The most common types of RCM reports include:
1. Financial Performance Reports
A/R aging analysis
Shows how receivables age so you can spot overdue balances, gauge collection timeliness, and forecast cash.
Metrics used:
- Outstanding AR by aging buckets
- Percentage of total a/r in each bucket
- AR Over 90 Days percentage
- Total outstanding A/R
- Average days in A/R
- Write-offs
AR aging report in action: Run an A/R aging analysis segmented into standard 30, 60, and 90-day buckets to understand the month-over-month decline in cash flow despite steady production levels.
This report uncovers:
- Locations or payers with the highest 60–90+ day balances.
- Delays in reimbursement or follow-up failures.
- Rising average days in AR indicates inefficiencies in collections or claim submission.
- Whether staff are prematurely writing off collectible accounts or failing to appeal denials.
The results show that two locations with A/R over 90 days exceeding 25%, primarily due to claim rejections from a top PPO payer. Comparing payer and front-office data reveals inconsistent eligibility checks and delayed follow-up on insurance rejections.
Using these insights, she implements a centralized claims follow-up process and automated reminders for aging claims. With these steps taken, she monitors whether 90+ day AR and average days in AR decline.
Operating margin report
Calculates the portion of revenue remaining after operating costs, a key profitability measure valued by CFOs.
Metrics include:
- Operating revenue
- Operating expenses
- Operating income
- Operating margin percentage
Operating margin report in action: Ahead of an executive meeting, run an operating margin report to explain why margins lag despite rapid, acquisition-driven growth.
Metrics include:
- Total collections per location to identify top and bottom performers
- Cost breakdowns by category to spot inefficiencies.
- Net profit before interest and taxes to evaluate true operational performance.
- Industry standards (typically 30–40% for dental practices) to assess competitiveness and scalability.
The report reveals that while most locations maintain operating margins of 32–38%, three recently acquired practices are operating at only 18–22%. Drilling deeper, he discovers that these practices incur higher staffing costs, higher supply expenses, and lower patient volume due to scheduling bottlenecks.
Using these insights, the DSO implements standardized staffing ratios, negotiates group purchasing agreements for supplies, and deploys centralized scheduling software. He monitors improvement in operating margins, aiming for 28–31%.
Revenue Forecast Report
Uses historical billing data and predictive analytics to estimate future revenue trends and cash inflows.
Metrics include:
- Patient volume and utilization rates
- Payer mix distribution
- Average reimbursement per claim
- Seasonal revenue variations
- Denial and adjustment rates
- Gross and net collection rates
- Contractual allowance percentages
- Predictive cash flow projections
- Revenue per patient visit
The revenue forecast report in action: Ahead of next quarter’s plan, uneven cash inflows (strong Q2, weak Q4) prompt the RCM leader to run a revenue forecast using three years of billing data and predictive analytics.
This report uncovers:
- Seasonal dips—such as slower patient visits during the holidays—and forecast expected patient volume by office.
- Project revenue by payer type (PPO, Medicaid, fee-for-service) to anticipate reimbursement fluctuations.
- Detect if recent payer contract changes or denial rates might reduce revenue.
- Evaluate how negotiated discounts or write-offs influence expected collections.
- Month-to-month collections to identify future cash shortfalls before they occur.
For example, the forecast flags a 15% Q1 revenue dip in Medicaid-heavy regions from state rate changes, while PPO markets should grow with campaigns. Leadership responds early—shifting staffing, delaying an equipment purchase, and rolling out preemptive billing to lift clean-claim rates through the slower quarter.
The RCM leader aims to maintain steady cash flow despite seasonal and payer-related fluctuations.
Bad debt report
Tracks uncompensated or written-off accounts to gauge financial policy performance and collection strategy effectiveness.
Metrics include:
- Bad debt percentage
- Bad debt rate
- Bad debt expense
- Bad debt ratio
- Bad debt recovery rate
- Patient collection rate
Bad debt report in action: Cash is slipping despite steady volume, so the RCM director runs a bad debt report across all locations to review six months of unpaid balances and write-offs.
This report uncovers:
- The proportion of total revenue being written off as uncollectible to gauge the health of the collection process.
- Which offices, especially those with weaker front-office collections or higher Medicaid volumes, are contributing disproportionately to lost revenue?
- How effectively the team is recovering balances previously deemed uncollectible.
- How much of patient responsibility is being successfully collected at or shortly after the point of service
The report reveals that three urban offices have a bad debt rate approaching 6%, double the organization’s target. Further investigation shows that these offices frequently delay patient invoicing and lack financial policy enforcement at check-in. By implementing pre-treatment financial discussions, text-to-pay options, and stricter follow-up guidelines, those locations have reduced their bad-debt percentage.
Payer mix analysis
Breaks down revenue by payer category (commercial, Medicaid, Medicare, self-pay) to evaluate risk exposure and profitability.
Metrics include:
- Payer mix percentage by payer type
- Revenue by payer type
- Reimbursement rate by payer
- Profit margin by payer
- Patient volume by payer
- Denial rate by payer
Payer mix analysis in action: Think about a revenue cycle director who notices declining profitability despite consistent patient volume. To understand the underlying cause, she runs a payer mix analysis comparing revenue, reimbursement rates, and volume across commercial payers, Medicaid, and self-pay categories.
This report uncovers:
- Payer mix percentage by payer type: Determine what percentage of revenue comes from Medicaid versus commercial payers and self-pay.
- Revenue by payer and profit margin by payer: Identify which payer relationships are profitable and which may be driving losses.
- Reimbursement rate by payer: Assess whether some insurance plans reimburse below cost or are slow to pay.
- Patient volume by payer: Evaluate whether certain offices are oversaturated with low-margin Medicaid patients compared to high-reimbursement PPO or fee-for-service patients.
The analysis reveals that in several urban markets, Medicaid patients account for 55% of visits but only 32% of revenue, with reimbursement rates 40% below commercial benchmarks.
Meanwhile, suburban locations have higher commercial payer ratios and operate with margins of 35% or greater. By recalibrating contract negotiations, increasing participation in better-paying PPOs, and redistributing marketing toward higher-value patient populations, leadership reduces the overall Medicaid payer mix to 40% while maintaining access for key demographics.
The RCM leader monitors DSO-wide profit margins, aiming to improve EBITDA performance without reducing patient care capacity. The CFO later uses these insights to renegotiate payer contracts system-wide, improving reimbursements on preventive and restorative codes.
2. Denial and Compliance Reports
Denial analysis report
Identifies top reasons for claim denials and quantifies their revenue impact, giving executives data for payer negotiations and internal training.

Metrics include:
- Denial rate
- Initial denial rate
- Total denial rate
- Clinical denial rate
- Denial volume (count of denials)
- Denial recovery rate
- Denial overturn rate
- Average days to appeal or resolve denials
The denial analysis report in action: Cash is slowing despite steady volume, so the RCM director runs a denial analysis to compare rates, reasons, and resolution patterns by location, payer, and procedure.
This report uncovers:
- What percentage of submitted claims are being denied and which locations or payers have the highest rates.
- Whether coding errors, missing documentation, eligibility lapses, or authorization issues are driving the denials.
- Whether delayed follow-up is slowing down cash flow and increasing staff workload.
- How successfully denied claims are appealed or recovered, and where appeals are most effective.
Analysis shows that denials are nearly 2x higher for major restorative PPO claims, driven by coding errors and missing documentation, with two offices causing most of the issues. Appeals succeed only 30% of the time due to late follow-up. Retraining on coding, enforcing front-end documentation checks, and prioritizing denial follow-up should cut denials and AR aging, speed up reimbursements, stabilize cash flow, and reduce rework so finance can forecast with confidence.
Charge integrity report
Audits missing, undercoded, or duplicate charges to ensure billing accuracy and compliance consistency.
Metrics include:
- Charge correction rate
- Charge reconciliation rate
- Charge accuracy percentage
- Compliance error rate
- Coding variance/error rate
Charge integrity report in action: Production is strong but collections lag, so the RCM director runs a charge integrity report to audit charge accuracy, missed/duplicate charges, coding errors, and compliance across sites and providers.
This report uncovers:
- The percentage of submitted claims being denied and which locations or payers have the highest rates.
- The proportion of submitted charges that are error-free and fully compliant.
- Instances of missing, duplicate, or undercoded procedures that result in lost revenue.
- Where initial codes are consistently changed or corrected by billing staff, signaling clinical documentation or front-end training issues.
- Patterns of upcoding, unbundling, or other coding violations increase audit risk or reimbursement delays.
The analysis shows that several offices are missing charges for high-revenue adjunct services, and one site routinely undercodes periodontal visits. Documentation gaps and outdated codes are the main drivers of revenue loss. The RCM lead retrains staff, adds software prompts for charge capture, and monitors compliance going forward.
As a result, the DSO’s charge reconciliation and accuracy rates improve, reducing write-offs due. She protects revenue, lowering audit risk, and supporting regulatory compliance across the organization.
3. Operational Performance Reports
Revenue leakage report
Flags points in the revenue cycle where revenue loss occurs—from coding errors to slow claim follow-up—and quantifies financial impact.
Metrics include:
- Coding error rate
- Underpayment rate
- Denial rate
- Claim rejection rate
- Write-off ratio
- Authorization failure rate
Revenue leakage report in action: Monthly collections are slipping despite steady volume, so the RCM leaders run a revenue leakage report to pinpoint losses from coding errors, denials, authorization gaps, and underpayments.
This report uncovers:
- The percentage of submitted claims being denied and which locations or payers have the highest rates.
- The percentage of submitted claims containing coding mistakes that result in denials or payment reductions.
- Claims where insurance payments are below the contracted or expected amount, flagging systematic under-reimbursement.
- The proportion of claims rejected by payers and the dollar value impact.
- How many claims are being rejected at the front end due to missing or incomplete data.
- The percentage of charges written off versus actual collections, distinguishing between contractual write-offs and avoidable losses.
- How often are claims denied due to missing or incorrect pre-authorizations.
Crowns and oral surgery show a 22% denial rate tied to CDT coding errors and missing documentation; underpayments cluster with two PPOs, and auth failures spike for high-cost procedures at three urban offices. The RCM director retrains on coding, adds authorization checklists, and automates denial appeals for high-value claims.
The director responds by retraining staff on coding accuracy, building new checklists for authorization workflows, and setting up automated denial appeals for high-value claims.
Clean claims report
Measures the percentage of claims submitted without error, serving as a core efficiency KPI for CFO dashboards.

Metrics include:
- Clean claim rate
- First-pass resolution rate
- Error-free claim count
- Claims rejection rate
- Claims denial rate
- Claims resubmission rate
Collections are slowing and payments are taking longer despite steady volume. Hence, the director runs a clean claims report to see what percentage are paid without rework and check data entry, coding, and payer-rule accuracy.
This report uncovers:
- The proportion of total claims submitted that are accepted by payers on the first pass without the need for edits, additional documentation, or appeals.
- Which locations generate the most clean claims, and which struggle with errors.
- How often are claims rejected before payer review due to missing procedure codes, incomplete patient info, or coverage gaps.
- How many claims are denied after initial payer review, often a sign of insufficient documentation or inaccurate coding.
- Frequency of claims that require correction and resubmission, adds admin overhead and delays cash flow.
Sites using claim-scrubbing and standardized front-desk docs keep clean claims >96%, while manual-entry offices see 2.5×\x higher resubmissions. Denials cluster around crowns, root canals, and oral surgery due to missing docs/outdated codes.
The RCM director rolls out automated eligibility, standardized intake forms, and coding refreshers to achieve>95% clean claims, lower denial rates, faster payments, better cash flow, less rework, and higher net collections.
First pass yield report
Evaluates the rate of claims paid upon first submission, a particularly relevant efficiency indicator for private equity performance reviews.
Metrics include:
- First pass yield (FPY)
- First pass resolution rate (FPRR)
- Claim acceptance rate
This report uncovers:
- The percentage of total claims paid in full on first submission by payer, procedure, or office.
- Which procedures, payers, or locations are lagging with repeat submissions or rework.
- Where claims are denied or underpaid on first pass, highlighting workflow or documentation weaknesses.
- The average time to payment for first-pass claims versus claims requiring resubmission, to gauge cash flow slowdowns.
The RCM leader’s analysis shows that hygiene services and routine exams have a first pass yield over 96%, while major restorative and surgical procedures lag at 79%—mostly due to incomplete documentation and unmet payer-specific requirements at two high-volume offices.
Additionally, one major insurance partner has a 13% first-pass denial rate across all locations, indicating possible issues with payer-specific rules or credentialing.
To address these gaps, the leader develops procedure-specific checklists for pre-submission documentation, invests in payer rule validation software, and retrains staff at the two outlier offices.
Over the next quarter, the DSO sees first pass yield improve for targeted codes. He also achieves faster payment timelines and reduced billing staff workload—leading to improved cash flow, higher monthly net collections, and operational benchmarks that give confidence to both leadership and investors.
Workflow analysis report
Maps process bottlenecks, staff productivity, and task cycle times to reveal system or staffing inefficiencies.
Metrics include:
- Staff productivity rate
- Average patient throughput
- Staff utilization rate
- Automation utilization rate
- Workflow bottleneck frequency
Since cash flow is uneven across sites, the RCM director runs a workflow analysis to assess cycle times, resubmission rates, and staff utilization to find bottlenecks.
This report uncovers:
- How effectively billing and collections teams are processing claims and managing follow-ups.
- Time taken from claim submission to payment for different claim types and locations, highlighting workflow delays.
- How often claims or accounts stall at specific workflow stages, such as eligibility verification or denial appeal.
- The extent to which automated tools are integrated and are reducing manual processes.
- The number of claims requiring rework indicates data entry errors or complexity bottlenecks.
The analysis shows that one regional office has 2x the resubmission rate and longer cycle times due to outdated software and limited training. Utilization is uneven and automation lags across several sites.
The director rolls out targeted training, upgrades systems, and expands automation. Six months later, efficiency improves, resubmissions fall, turnaround shortens, and cash flow steadies. This reduces admin burden and improves transparency for better decisions and investor confidence.
InsideDesk’s Comprehensive RCM Reporting Empowers Revenue Cycle Leaders
As a revenue cycle management leader, you want to walk into executive meetings with the RCM reporting that shows you are proactively managing revenue leaks, underperforming payers and locations, and process bottlenecks. Most likely, you’ll quickly follow your reporting with strategies for improvement.
Executives and investors rely on metrics to understand performance. Clear, relevant RCM metrics are essential for highlighting concerns and potential. Monitoring and reacting to Dental RCM metrics builds resiliency, drives smarter revenue recovery, and achieves sustained growth in the shifting dental market.
InsideDesk’s purpose-built dental RCM platform is designed to elevate DSOs seeking both growth and operational efficiency. InsideAssist automates claims management, denial handling, and EOB retrieval, freeing teams from repetitive tasks and enabling them to focus on higher-impact collections and resolution. With InsideIQ’s customizable benchmarking and AR reporting, DSO leaders gained the clarity needed to address workflow bottlenecks and track revenue trends across multiple locations.
To see how InsideDesk can help your organization streamline dental RCM and empower smarter growth decisions, request a demo today.